I had a look through this defense of the Hockey Stick over at Realclimate. The author is Tamino. Here he writes at length defending Michael Mann's hockey stick graph against Steve McIntyre, Andrew Monfort, and others. He insults their integrity and character. I'm not surprised. Tamino called me an idiot and blocked me from commenting on his website when I asked, "Has there been any statistically significant warming in the past twenty years?"
Steve McIntyre has his own answer to Tamino's post. He concentrates upon how Tamino mis-quotes him.
But here's my answer to Tamino. The central argument against the Hockey Stick, as put forward by Steve McIntyre and Ross McKitrick, and confirmed by the Wegman Repot for the US congress, is that Michael Mann's data analysis generates the hockey stick from random proxy data. We explain how his analysis produces the hockey stick here, and I first posted about the effect here.
Nowhere in Tamino's discussion do I see any mention of the fact that random proxy data combined with CRU's global surface trend produces a hockey stick. Given that random input produces the hockey stick, it's pretty clear that the graph has no statistical significance. When I said as much in a comment at Realclimate, my comment was blocked. That's the third comment of mine that Realclimate has blocked.
UPDATE: In addition to the temperature hockey stick, there is also a CO2 hockey stick that you get by splicing modern CO2 measurements onto the end of the ice core measurements, like this. We talk about such splicing in the Ice Cores and Carbon Dioxide sections here. In Questioning the CO2 Hockey Stick, Jaworowski et al. challenge the absolute accuracy of the ice core CO2 measurements.
UPDATE: There's a new paper out in the Annals of Applied Science, A Statistical Analysis of Multiple Temperature Proxies: Are Reconstructions of Surface Temperature Over the Last 1000 Years Reliable? by McShane et al. You will find a copy of the paper here. The paper concludes that Michael Mann's method produces a hockey stick graph from random data, and that the hockey stick shape has no statistical significance.
UPDATE: In the new Realclimate discussion about the McShane paper, I again attempted to post a comment stating that Mann's method generated the hockey stick from random data. That's my third attempt to make the same statement. Comments posted after mine have now appeared. I assume my comment was blocked. So far as I can tell, nowhere in this latest discussion does any comment or the author mention the fact that Mann's method produces the hockey stick from random data. [24-AUG-10]
Wednesday, July 28, 2010


Tuesday, July 20, 2010
The Second 3-km Layer
The following graph shows the absorption of long-wave radiation by the second 3-km layer of the Earth's atmosphere, from altitude 3 km to 6 km. The graph is typical of a clear day in April, at latitude 30° North. Water vapor content is 3,000 ppm (that's 0.3%), CO2 is 330 ppm, air pressure is 740 mbar, and air temperature is 270 K (that's −3°C). This line is the same as the 3-km line in our Earth's Atmosphere post.

In our previous post, we concluded that the first 3-km layer was transparent only between 8 μm and 13 μm. By transparent we mean that less than 63% of radiation is absorbed. We settled upon this definition of transparent in Upper Gas. Our definition is an approximation, and is to some extent arbitrary. We could have chosen 10% absorption or 30% absorption. But 63% absorption is what occurs after one absorption length in a medium, so it is a convenient value. Given our definition of transparent, we will say the layer is opaque, whenever it is not transparent. So our definition of transparent, which we will use later in a computer program that models the absorption and radiation of the layers, will be binary, and therefore simple to implement, without any significant loss in accuracy.
With our simple, binary, definition of transparent, we see that the second 3-km layer is transparent from 7.6 to 13.4 μm and for a small range from 17.7 to 18.8 μm. The emerging transparency around 18 μm is due to the drop in water vapor concentration and pressure that occurs as we ascend through the atmosphere. For wavelengths around 18 μm, absorption by water vapor is dominated by absorption in water dimers. As we saw in earlier, absorption by dimers is proportional to the square of the water vapor pressure, and drops rapidly with altitude.
The first 3-km layer is opaque to wavelengths 7.6 to 8.0 μm, 13.0 to 13.4 μm, and 17.7 to 18.8 μm, but the second and higher layers are transparent to these wavelengths. By the principle of radiative symmetry, the first 3-km layer will radiate in the ranges for which it is opaque. Wavelengths in these three ranges will be radiated by the first 3-km layer and pass out through the upper layers and into space.
In our previous post, we concluded that the first 3-km layer was transparent only between 8 μm and 13 μm. By transparent we mean that less than 63% of radiation is absorbed. We settled upon this definition of transparent in Upper Gas. Our definition is an approximation, and is to some extent arbitrary. We could have chosen 10% absorption or 30% absorption. But 63% absorption is what occurs after one absorption length in a medium, so it is a convenient value. Given our definition of transparent, we will say the layer is opaque, whenever it is not transparent. So our definition of transparent, which we will use later in a computer program that models the absorption and radiation of the layers, will be binary, and therefore simple to implement, without any significant loss in accuracy.
With our simple, binary, definition of transparent, we see that the second 3-km layer is transparent from 7.6 to 13.4 μm and for a small range from 17.7 to 18.8 μm. The emerging transparency around 18 μm is due to the drop in water vapor concentration and pressure that occurs as we ascend through the atmosphere. For wavelengths around 18 μm, absorption by water vapor is dominated by absorption in water dimers. As we saw in earlier, absorption by dimers is proportional to the square of the water vapor pressure, and drops rapidly with altitude.
The first 3-km layer is opaque to wavelengths 7.6 to 8.0 μm, 13.0 to 13.4 μm, and 17.7 to 18.8 μm, but the second and higher layers are transparent to these wavelengths. By the principle of radiative symmetry, the first 3-km layer will radiate in the ranges for which it is opaque. Wavelengths in these three ranges will be radiated by the first 3-km layer and pass out through the upper layers and into space.
Saturday, July 17, 2010
The Surface Layer
The following graph shows the absorption of long-wave radiation by the first three kilometers of the Earth's atmosphere. The graph is typical of a clear day in April, at latitude 30° North. Water vapor content is 10,000 ppm (that's 1%), CO2 is 330 ppm, air pressure is 1000 mbar, and air temperature is 280 K (that's 7°C). This line is the same as the 0-km line from our Earth's Atmosphere post.

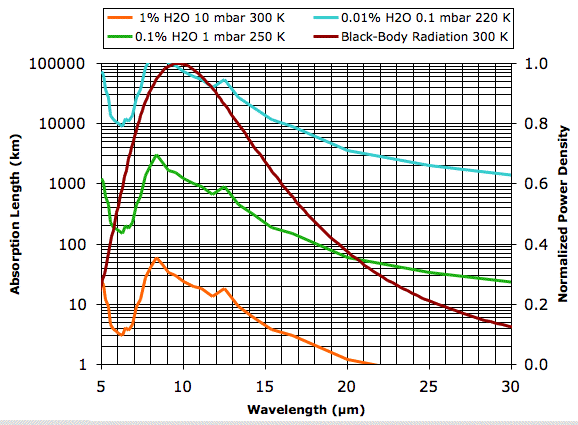
The 5 μm to 30 μm range includes over 95% of the heat radiated by the Earth's surface (look at the brown power density line in this graph). We see that the first 3 km of the atmosphere absorbs almost all radiation from 13 μm to 30 μm, and from 5 μm to 8 μm. According to the Spectral Calculator, the absorption between 5 μm and 8 μm is due to water vapor, between 13 μm and 17 μm is due to CO2, and above 17 μm is due to the water vapor again.
Most radiation between 8 μm and 13 μm passes through the first 3 km of the atmosphere. The higher layers, being thinner and more sparsely supplied with water vapor, absorb even less of this radiation, as you can see in our compound graph. To the first approximation, the first 3 km layer of the atmosphere is transparent from 8 to 13 μm and opaque to other long-wave radiation. The 8 to 13 μm radiation emitted by the Earth's surface will pass right through the atmosphere and into space, provided there are no clouds. As we declared in our recent review, we are ignoring clouds for the time being.
In our up-coming posts, we will consider each 3-km layer of the atmosphere up to altitude 18 km in turn. We will approximate each layer as being transparent to some wavelengths and opaque to others. Once we have considered all the layers, we will write a computer program to calculate the radiation of heat from the various layers, and so obtain an estimate of the Earth's greenhouse effect without clouds.
The 5 μm to 30 μm range includes over 95% of the heat radiated by the Earth's surface (look at the brown power density line in this graph). We see that the first 3 km of the atmosphere absorbs almost all radiation from 13 μm to 30 μm, and from 5 μm to 8 μm. According to the Spectral Calculator, the absorption between 5 μm and 8 μm is due to water vapor, between 13 μm and 17 μm is due to CO2, and above 17 μm is due to the water vapor again.
Most radiation between 8 μm and 13 μm passes through the first 3 km of the atmosphere. The higher layers, being thinner and more sparsely supplied with water vapor, absorb even less of this radiation, as you can see in our compound graph. To the first approximation, the first 3 km layer of the atmosphere is transparent from 8 to 13 μm and opaque to other long-wave radiation. The 8 to 13 μm radiation emitted by the Earth's surface will pass right through the atmosphere and into space, provided there are no clouds. As we declared in our recent review, we are ignoring clouds for the time being.
In our up-coming posts, we will consider each 3-km layer of the atmosphere up to altitude 18 km in turn. We will approximate each layer as being transparent to some wavelengths and opaque to others. Once we have considered all the layers, we will write a computer program to calculate the radiation of heat from the various layers, and so obtain an estimate of the Earth's greenhouse effect without clouds.
Friday, July 9, 2010
Heat Transport and Lapse Rate
Over at RealClimate we find a post entitled A Simple Recipe for GHE by someone called Rasmus. The post is an attempt to explain the greenhouse effect, and to convince us that a doubling the CO2 concentration will raise the Earth's surface temperature by a few degrees Centigrade. We have already claimed that all explanations of the greenhouse effect we encountered on the web violated at least one law of physics or thermodynamics. The manner in which this new explanation violates the laws of thermodynamics is interesting enough to merit a short discussion.
The author agrees with our conclusion that the Earth's atmosphere radiates its heat at an altitude where it becomes transparent. And so he brings the atmospheric temperature lapse rate to our attention in his section (iv). The lapse rate is the drop in temperature with altitude. In Atmospheric Convection we found that the drop in temperature with altitude is the result of the adiabatic expansion of gas during during the transport of heat by convection to the upper atmosphere. If there were no greenhouse gases in the atmosphere, there would be no radiation of heat by the upper atmosphere, and no heat to transport. With no heat to transport, there would be no convection, no adiabatic expansion, and therefore no atmospheric lapse rate. To suggest that a convection cycle can exist in a viscous fluid without the transport of heat and without any source of physical work, such as a paddle, is to believe in a perpetual motion machine. In the comments of Motl on CO2 Sensitivity you will see us debating this same issue with a reader. The reader claims that convection will take place even in a transparent atmosphere without any machines to move the air and without any upward heat transport. Rasmus appears to share our reader's belief, because he makes no mention of the relationship between heat transport and atmospheric lapse rate. He refers to hydrostatic balance, but such balance in no way requires a drop in temperature.
When we ignore the dependence of the atmospheric lapse rate upon heat transport, we conclude that the atmosphere keeps cooling as we go up, so that there is no layer in the atmosphere where the lapse stops. In short, Rasmus's understanding of the lapse rate implies that there is no tropopause, even though the existence of the tropopause in the Earth's atmosphere is well-established. In the first comment following the post, we see a reader asking some cogent questions about the tropopause, and Rasmus answering that the tropopause is above the highest altitude of heat radiation by the atmosphere. But this cannot be true, because without vertical heat flow, the temperature of the atmosphere would not be dropping. The tropopause must mark the upper limit of the atmospheric heat transport away from the Earth.
Rasmus's argument requires that we set aside the law of conservation of energy, which is the First Law of Thermodynamics. We prefer explanations that adhere to established laws, so we feel justified in dismissing his post.
PS. Originally spelled "lapse" without the "e", but corrected spelling in title and text after Chuck pointed out my error, see comments.
The author agrees with our conclusion that the Earth's atmosphere radiates its heat at an altitude where it becomes transparent. And so he brings the atmospheric temperature lapse rate to our attention in his section (iv). The lapse rate is the drop in temperature with altitude. In Atmospheric Convection we found that the drop in temperature with altitude is the result of the adiabatic expansion of gas during during the transport of heat by convection to the upper atmosphere. If there were no greenhouse gases in the atmosphere, there would be no radiation of heat by the upper atmosphere, and no heat to transport. With no heat to transport, there would be no convection, no adiabatic expansion, and therefore no atmospheric lapse rate. To suggest that a convection cycle can exist in a viscous fluid without the transport of heat and without any source of physical work, such as a paddle, is to believe in a perpetual motion machine. In the comments of Motl on CO2 Sensitivity you will see us debating this same issue with a reader. The reader claims that convection will take place even in a transparent atmosphere without any machines to move the air and without any upward heat transport. Rasmus appears to share our reader's belief, because he makes no mention of the relationship between heat transport and atmospheric lapse rate. He refers to hydrostatic balance, but such balance in no way requires a drop in temperature.
When we ignore the dependence of the atmospheric lapse rate upon heat transport, we conclude that the atmosphere keeps cooling as we go up, so that there is no layer in the atmosphere where the lapse stops. In short, Rasmus's understanding of the lapse rate implies that there is no tropopause, even though the existence of the tropopause in the Earth's atmosphere is well-established. In the first comment following the post, we see a reader asking some cogent questions about the tropopause, and Rasmus answering that the tropopause is above the highest altitude of heat radiation by the atmosphere. But this cannot be true, because without vertical heat flow, the temperature of the atmosphere would not be dropping. The tropopause must mark the upper limit of the atmospheric heat transport away from the Earth.
Rasmus's argument requires that we set aside the law of conservation of energy, which is the First Law of Thermodynamics. We prefer explanations that adhere to established laws, so we feel justified in dismissing his post.
PS. Originally spelled "lapse" without the "e", but corrected spelling in title and text after Chuck pointed out my error, see comments.
Saturday, July 3, 2010
Earth's Atmosphere
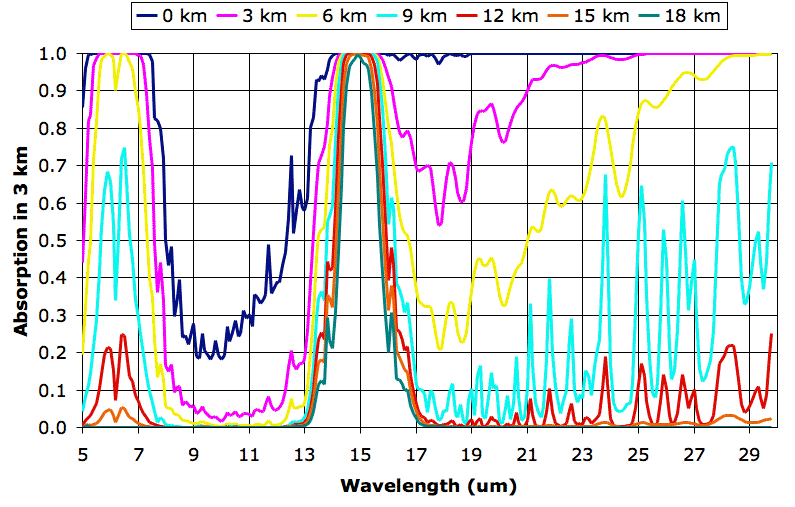
The following graph shows how various layers of the Earth's atmosphere absorb long-wave radiation. We plot wavelength on the horizontal axis. On the vertical axis we plot the fraction of radiation absorbed along a 3-km path. There are seven absorption plots. Each plot corresponds to a different altitude. The 0-km plot gives the absorption along a 3-km path through a mixture of air and water vapor that is typical at sea-level in the Earth's atmosphere at latitude 30° north. The 3-km plot gives absorption along a 3-km path through a mixture that is typical at altitude 3 km. The final plot gives the absorption along a 3-km path through a mixture typical at 18 km. Click on the graph for a larger version.
We obtained the individual plots of absorption along a 3 km path using the Spectral Calculator. We obtained our typical values for temperature and water vapor content from these plots. We obtained the pressure using the approximate formula for atmospheric pressure with altitude that we derived in Atmospheric Pressure. The following table shows the values we used.

Each plot serves as an estimate of how much radiation will pass through a 3-km layer of the atmosphere from below. The 0-km plot shows that almost all the long-wave radiation emitted by the Earth is absorbed in the first 3 km of the atmosphere, except for wavelengths between 8 μm and 13 μm. Wavelengths between 8 μm and 13 μm pass all the way through the atmosphere. At altitude 9 km, we see the atmosphere starts to become transparent to wavelengths greater than 16 μm. Absorption between 14 μm and 16 μm at altitude 18 km is due to CO2.
In future posts, we will show how these plots allow us to estimate the altitude of the Earth's tropopause and estimate the effect of CO2 concentration upon the Earth's surface temperature.
We obtained the individual plots of absorption along a 3 km path using the Spectral Calculator. We obtained our typical values for temperature and water vapor content from these plots. We obtained the pressure using the approximate formula for atmospheric pressure with altitude that we derived in Atmospheric Pressure. The following table shows the values we used.
Each plot serves as an estimate of how much radiation will pass through a 3-km layer of the atmosphere from below. The 0-km plot shows that almost all the long-wave radiation emitted by the Earth is absorbed in the first 3 km of the atmosphere, except for wavelengths between 8 μm and 13 μm. Wavelengths between 8 μm and 13 μm pass all the way through the atmosphere. At altitude 9 km, we see the atmosphere starts to become transparent to wavelengths greater than 16 μm. Absorption between 14 μm and 16 μm at altitude 18 km is due to CO2.
In future posts, we will show how these plots allow us to estimate the altitude of the Earth's tropopause and estimate the effect of CO2 concentration upon the Earth's surface temperature.
Thursday, June 24, 2010
Greenhouse Effect Review
The greenhouse effect occurs when a planet's atmosphere is transparent to short-wave radiation arriving from its sun, but opaque to long-wave radiation emitted by the planet itself. Gases that bestow these properties upon an atmosphere are called greenhouse gases. So far, we have explored the greenhouse effect in the context of hypothetical examples such as our Extreme Greenhouse and Planetary Greenhouse.
In a planetary greenhouse, the lower atmosphere absorbs long-wave radiation. But the ability of any substance to absorb radiation is exactly matched by its ability to emit radiation. Thus the lower atmosphere emits long-wave radiation with the same efficiency that it absorbs long-wave radiation. Furthermore, although the lower atmosphere is opaque to long-wave radiation, the atmosphere gets progressively thinner as we ascend, so we are sure to come to an altitude where the atmosphere is so thin that it is transparent. Thus the middle atmosphere radiates heat out into space through the thin, upper atmosphere. The amount of heat the middle atmosphere radiates into space is proportional to the fourth power of its absolute temperature. The middle atmosphere will cool down until it radiates into space no more heat than it gains from the planet surface.
Greenhouse gases give rise to atmospheric convection. Gas in the middle atmosphere radiates heat into space and cools down. It contracts as it cools down, and becomes more dense. It sinks towards the planet surface. As it sinks, the surrounding atmosphere compresses it, causing it to warm up. But the sinking gas remains marginally cooler than the surrounding atmosphere, and so it continues to sink. When it reaches the planet surface, it stops sinking. The planet surface warms it up. Once it is warm enough, it becomes less dense and rises. As it rises, it compresses the surrounding atmosphere, and so cools down. But the rising gas remains marginally warmer than the surrounding atmosphere, and so it continues to rise. When it reaches the middle atmosphere, it starts to radiate heat into space. It cools down. The top of this convection cycle is the altitude at which the atmosphere stops cooling. We call it this altitude the tropopause.
In Work by Convection we showed that atmospheric convection generates power. This power causes the weather. Powerful weather is a feature of the greenhouse effect. The powerful weather extends only up to the tropopause, which is the upper extent of the convection cycle.
Atmospheric convection transports heat from the planet surface to the tropopause. But the amount of heat the convection cycle transports has very little effect upon the temperature drop from the bottom to the top of the cycle. Instead, it is the ratio of the pressure at the bottom to the pressure at the top that determines the temperature drop. An understanding of convection allows us to use the equations for adiabatic compression to calculate the warming caused by the greenhouse effect. If, for example, the pressure in the tropopause 30 kPa and the temperature is 210 K (−63°C), while the pressure at the surface is 100 kPa, then the temperature at the surface must be close to 300 K (27°C).
The temperature of the tropopause itself is, however, determined by the amount of heat it must radiate into space. The amount of heat it must radiate is determined by the manner in which the atmosphere absorbs long-wave radiation. We have considered a transparent atmosphere, an atmosphere that is opaque to all long-wave radiation, and an atmosphere that is transparent to some long-wave radiation but opaque otherwise. In more recent posts, we have considered the long-wave absorption spectra of water vapor and carbon dioxide. We found that doubling the concentration of a trace greenhouse gas causes progressively smaller increases in surface temperature.
So far, we have ignored the effect of clouds. Clouds have a strong effect upon the Earth's climate. They are made up of tiny water droplets, and are opaque to all long-wave radiation. At the same time, they reflect all short-wave radiation from the sun. Roughly a third of the Earth's surface is covered by clouds at any one time, and they reflect roughly a third of the Sun's radiation back into space, which tends to lower the temperature of the surface. But clouds block some surface radiation from reaching outer space, which tends to raise the surface temperature.
We are going to ignore clouds for now, but we will consider them in detail eventually. We are building up our understanding of the Earth's greenhouse effect one step at a time. In our next post, we will consider the absorption spectra of carbon dioxide and water vapor as they occur together in various layers of the Earth's atmosphere. We will obtain our spectra with the help of astronomy's Spectral Calculator.
In a planetary greenhouse, the lower atmosphere absorbs long-wave radiation. But the ability of any substance to absorb radiation is exactly matched by its ability to emit radiation. Thus the lower atmosphere emits long-wave radiation with the same efficiency that it absorbs long-wave radiation. Furthermore, although the lower atmosphere is opaque to long-wave radiation, the atmosphere gets progressively thinner as we ascend, so we are sure to come to an altitude where the atmosphere is so thin that it is transparent. Thus the middle atmosphere radiates heat out into space through the thin, upper atmosphere. The amount of heat the middle atmosphere radiates into space is proportional to the fourth power of its absolute temperature. The middle atmosphere will cool down until it radiates into space no more heat than it gains from the planet surface.
Greenhouse gases give rise to atmospheric convection. Gas in the middle atmosphere radiates heat into space and cools down. It contracts as it cools down, and becomes more dense. It sinks towards the planet surface. As it sinks, the surrounding atmosphere compresses it, causing it to warm up. But the sinking gas remains marginally cooler than the surrounding atmosphere, and so it continues to sink. When it reaches the planet surface, it stops sinking. The planet surface warms it up. Once it is warm enough, it becomes less dense and rises. As it rises, it compresses the surrounding atmosphere, and so cools down. But the rising gas remains marginally warmer than the surrounding atmosphere, and so it continues to rise. When it reaches the middle atmosphere, it starts to radiate heat into space. It cools down. The top of this convection cycle is the altitude at which the atmosphere stops cooling. We call it this altitude the tropopause.
In Work by Convection we showed that atmospheric convection generates power. This power causes the weather. Powerful weather is a feature of the greenhouse effect. The powerful weather extends only up to the tropopause, which is the upper extent of the convection cycle.
Atmospheric convection transports heat from the planet surface to the tropopause. But the amount of heat the convection cycle transports has very little effect upon the temperature drop from the bottom to the top of the cycle. Instead, it is the ratio of the pressure at the bottom to the pressure at the top that determines the temperature drop. An understanding of convection allows us to use the equations for adiabatic compression to calculate the warming caused by the greenhouse effect. If, for example, the pressure in the tropopause 30 kPa and the temperature is 210 K (−63°C), while the pressure at the surface is 100 kPa, then the temperature at the surface must be close to 300 K (27°C).
The temperature of the tropopause itself is, however, determined by the amount of heat it must radiate into space. The amount of heat it must radiate is determined by the manner in which the atmosphere absorbs long-wave radiation. We have considered a transparent atmosphere, an atmosphere that is opaque to all long-wave radiation, and an atmosphere that is transparent to some long-wave radiation but opaque otherwise. In more recent posts, we have considered the long-wave absorption spectra of water vapor and carbon dioxide. We found that doubling the concentration of a trace greenhouse gas causes progressively smaller increases in surface temperature.
So far, we have ignored the effect of clouds. Clouds have a strong effect upon the Earth's climate. They are made up of tiny water droplets, and are opaque to all long-wave radiation. At the same time, they reflect all short-wave radiation from the sun. Roughly a third of the Earth's surface is covered by clouds at any one time, and they reflect roughly a third of the Sun's radiation back into space, which tends to lower the temperature of the surface. But clouds block some surface radiation from reaching outer space, which tends to raise the surface temperature.
We are going to ignore clouds for now, but we will consider them in detail eventually. We are building up our understanding of the Earth's greenhouse effect one step at a time. In our next post, we will consider the absorption spectra of carbon dioxide and water vapor as they occur together in various layers of the Earth's atmosphere. We will obtain our spectra with the help of astronomy's Spectral Calculator.
Thursday, June 17, 2010
CO2 Continuum
In CO2 Spectrum we present the absorption spectrum of pure CO2. In Water Vapor Continuum we suggested that we might be able to calculate the absorption spectrum of CO2 mixed with air by dividing the absorption spectrum of pure CO2 by the concentration of CO2 in the air. If the absorption length of 20-μm radiation in pure CO2 is 1 m, the absorption length in air with 0.033% CO2 would be 3 km. Such a calculation assumes that absorption takes place entirely within individual CO2 molecules, and is unaffected by interactions with other molecules.
In Water Vapor Continuum we found that a simple scaling of absorption with concentration is grossly inaccurate for water vapor. In Earth Radiator we showed that a 1-mm layer of water absorbs over 99.9% of all long-wave radiation. The graphs we present in Continuum Absorption Length imply that the same amount of water dispersed in a 1-km column of air will absorb less than 10% of long-wave radiation.
It turns out that a simple scaling calculation does not apply to CO2 either. If the absorption length of 20-μm radiation were 3 km in air with 330 ppm CO2, the Earth's atmosphere would be opaque to 20-μm radiation. But according to this popular graph, the CO2 in the Earth's atmosphere is transparent to 20 μm radiation.
In Absorption Line Broadening in the Infrared by Burch et al, we see how the presence of nearby molecules of all gases broadens the sharp absorption lines of the CO2 molecule. With high enough pressure, these lines become so broad that they overlap, and we see absorption of long-wave radiation at all frequencies within certain ranges, such as 13 μm to 17 μm.
We concluded that calculating the absorption spectra of water vapor and CO2 was far too big a project for us to embark upon. So we paid for a month's subscription to the most excellent Spectral Calculator. We asked the calculator to plot absorption by dry air with 330 ppm CO2 at 300 K and 1 atmosphere over a path length of 1 km. The calculator produced the following graph. For a logarithmic plot of the same data see here.
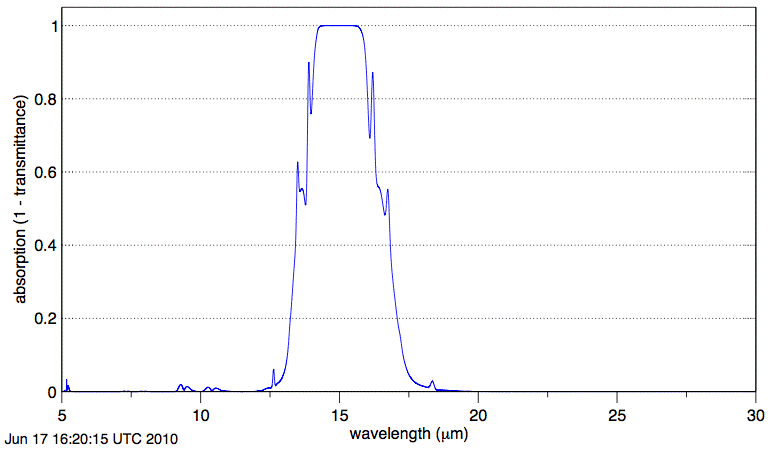
Absorption by CO2 along our 1-km path is negligible at wavelength 20 μm. The graph shows us that absorption of long-wave radiation by atmospheric CO2 is significant only in the range 12.5 μm to 17.5 μm.
In Water Vapor Continuum we found that a simple scaling of absorption with concentration is grossly inaccurate for water vapor. In Earth Radiator we showed that a 1-mm layer of water absorbs over 99.9% of all long-wave radiation. The graphs we present in Continuum Absorption Length imply that the same amount of water dispersed in a 1-km column of air will absorb less than 10% of long-wave radiation.
It turns out that a simple scaling calculation does not apply to CO2 either. If the absorption length of 20-μm radiation were 3 km in air with 330 ppm CO2, the Earth's atmosphere would be opaque to 20-μm radiation. But according to this popular graph, the CO2 in the Earth's atmosphere is transparent to 20 μm radiation.
In Absorption Line Broadening in the Infrared by Burch et al, we see how the presence of nearby molecules of all gases broadens the sharp absorption lines of the CO2 molecule. With high enough pressure, these lines become so broad that they overlap, and we see absorption of long-wave radiation at all frequencies within certain ranges, such as 13 μm to 17 μm.
We concluded that calculating the absorption spectra of water vapor and CO2 was far too big a project for us to embark upon. So we paid for a month's subscription to the most excellent Spectral Calculator. We asked the calculator to plot absorption by dry air with 330 ppm CO2 at 300 K and 1 atmosphere over a path length of 1 km. The calculator produced the following graph. For a logarithmic plot of the same data see here.
Absorption by CO2 along our 1-km path is negligible at wavelength 20 μm. The graph shows us that absorption of long-wave radiation by atmospheric CO2 is significant only in the range 12.5 μm to 17.5 μm.
Subscribe to:
Posts (Atom)