Wednesday, January 26, 2011

Circulating Cells

Today we present our new simulation program, Circulating Cells, Version 1, or CC1. The following picture shows the program's display shortly after we start it up. The array of cells represents a cross-section of the atmosphere. Each cell represents an equal mass of gas. The color of the cells indicates their absolute temperature, according to the legend at the top, with the exception of the black one. The black cell is black so we can watch it circulating around.

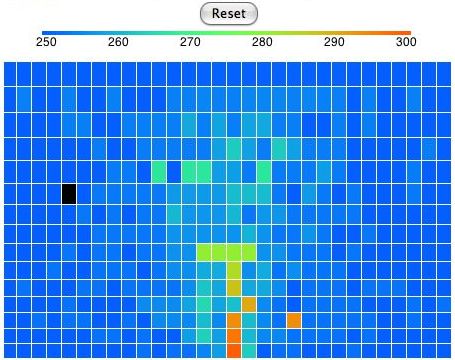
This version of the program heats one location on the bottom row. Any cell that enters this location we heat to 300 K. If the cell enters at a higher temperature, we let it keep its higher temperature. Thus we never remove heat from our array. The hot cells are rising, and as they rise they cool down. They turn from red to green. Meanwhile, cold cells must descend to make way for the hot cells. The cells that descend warm up. They turn from blue to green. At the beginning of our simulation, all the cells are blue. They are at 250 K. If we press Reset, all the cells will return to 250 K and the simulation will start again.

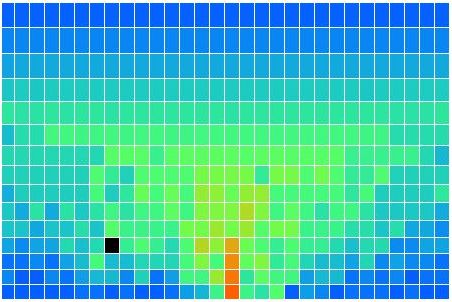
In our simulation, convection occurs by rotating blocks of four cells. The program picks a block of four cells at random. It calculates how much a quarter-turn will raise or lower the block's center of gravity. If a rotation will lower the center of gravity, the program performs the rotation. Otherwise, it does not. When the program rotates a block, one cell rises, one falls, and two stay at the same height. The one that falls contracts and warms up. The one that rises expands and cools down. The two cells that move sideways do not change temperature. But they may rise when they move from the top of a cold cell to the top of a hot cell. Hot cells are taller than cold cells. In the following picture we see the distribution of heat in the atmosphere after a few minutes of running. The black cell has moved. We can turn any cell into a black cell by clicking on it with the mouse. We can turn any black cell back into a normal cell by clicking it again.

The simulation is made possible by a fundamental approximation. We arrange the cells as if the cells in each row are all at the same height, even though some may be sitting on top of columns of air that are significantly warmer or cooler than the others. Without this approximation, we cannot arrange the cells in an array, and simulation becomes several orders of magnitude more complex and time-consuming.

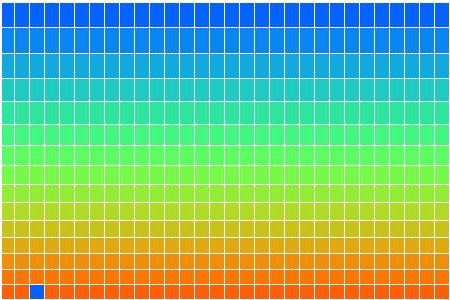
In CC1, there is no way for heat to pass from one cell to another. There is no conduction, no mixing, and no radiation. There is no way for heat to leave the array. After an hour of running, we end up with the following distribution of heat, all arising from the single heated location at the center of the bottom row. There is one blue cell on the bottom remaining. It moves around a bit, but so far it has resisted being drawn into the warm location.

Our program is written in TclTk. We encourage you to download the program and run it for yourself. Click here to download the program. Instructions for how to run the simulation on Linux, MacOS, and Windows are in the comments at the top of the program. Open CC_1.tcl with a text editor to read those instructions. Once the program is running, the movement of the cells is fascinating. Further comments in the program show how each routine works.

Without self-regulation by clouds we estimate that high clouds will warm the Earth by 38°C, doubling CO2 will warm the Earth by 1.5°C, and thick clouds will cool the Earth by 96°C. It is our hope that Circulating Cells will evolve into a simulation of radiation, convection, precipitation, and, ultimately, self-regulation by clouds. We will then be able to estimate the effect of doubling CO2 concentration within a self-regulating climate. That evolution may take another year or two, and maybe the task will prove too monumental for us. But I think it will be an enjoyable journey, no matter how it ends. So I hope you will accompany me.

Monday, January 17, 2011

Adiabatic Balloons

In Atmospheric Convection we described how rising air must expand and cool, while falling air must compress and warm. We used the equation for the adiabatic expansion of diatomic gases to estimate the amount by which air will cool as it rises through the atmosphere.

In a debate that took place in the comments, one of our readers claimed that a temperature difference must always exist between the bottom and the top of an atmosphere. Air is always circulating to some degree, he said, and any air that rises must cool adiabatically. He asserted that the temperature as we ascend through the atmosphere will be related to the pressure by the equation of adiabatic expansion. In Adiabatic Magic, however, we showed that our reader's claim violated the Second Law of Thermodynamics. Spontaneous adiabatic circulation of air in the atmosphere is impossible.

If spontaneous, adiabatic circulation is impossible, there must be some physical process that stops it from happening. Although we have proved that some such process must exist, we have not yet described the process. We will attempt to do so today.

Consider the following diagram. We have a column of air 5 km high, enclosed in a box. The temperature of the air is uniformly equal to 250 K. Because of the weight of the air, the pressure at the bottom is twice the pressure at the top. We have a balloon of air at the top, and another at the bottom. Each balloon is insulating and reflecting, so no heat passes in or out. Each balloon is flexible, so the pressure of the gas inside is always equal to the pressure outside.


We attach a string to the upper balloon and start to pull it down. As it descends, the air around it pushes in upon it with greater pressure so as to compress its volume. The air inside undergoes adiabatic compression. Its pressure, p, and temperature, T, are such that the product p 0.4T −1.4 remains constant.

We pull the balloon all the way down to the bottom of the column. Its pressure has doubled, so its temperature must rise from 250 K to 305 K. Our balloon has grown smaller, so the surrounding atmosphere must have expanded, and therefore cooled. But suppose our column is enormous compared to the balloon, so the cooling of the air outside the balloon is negligible. The air inside is at 305 K, and that outside remains at 250 K. The density of the air outside is 305/250 = 1.2 times greater than that of the air inside. Every kilogram of air in the balloon occupies the same volume as 1.2 kg of air outside the balloon.

By the principal of buoyancy, every kilogram of air in the balloon will experience an upward force equal to the weight of 0.2 kg of air. If we assume gravity is 10 m/s/s, we see that we must hold the balloon down with a force equal to 2 N/kg (two Newton per kilogram of air inside) or else it will rise, and it won't stop until it gets to the top again.

This buoyancy force was zero when we started pulling the balloon down, and at the end it was 2 N/kg. The average force would be close to 1 N/kg, which we apply over 5 km, so we must do roughly 5 kJ/kg of work to pull the balloon down.

Now suppose we pull the lower balloon up from the bottom at the same time. The net change in the volume of the rest of the column is is now zero, so we really can say that the outside air remains at 250 K. This other balloon, when it reaches the top of the column, will have expanded. It's pressure has halved, so its temperature must drop from 250 K to 205 K. It's density is 1.2 times greater than the air around it, so it will experience a negative buoyancy force of 2 N/kg. If we don't pull it up, it will sink all the way to the bottom again. In drawing it up, we must do 5 kJ/kg of work.

We must do 5 kJ of work to raise a single kilogram of air from the bottom to the top, and 5 kJ to lower another kilogram from the top to the bottom. Thus we see that the spontaneous circulation of air suggested by the Adiabatic Magic hypothesis is indeed impossible. It is buoyancy that stops the magic. We need a source of work to cause circulation, and no such source exists in our column of air at a uniform temperature.

One source of the necessary work is a heat engine in which we supply heat at a higher temperature to the bottom of the column and extract heat at a lower temperature from the top. Any time we have a source of heat at a higher temperature, and a place for the heat to flow to at a lower temperature, we can make a machine that does work. In the atmosphere, this machine is implemented, albeit inefficiently, by convection. We discussed work by convection earlier, but we we will return to it in future posts.

UPDATE: I originally made the column 10 km high, but Michele pointed out that I had my math wrong. The column should be 5 km high. Indeed, it turns out that the heigh of the column for which we have half the pressure at the top is a function of temperature only, which did not occur to me until I tried to duplicate Michele's calculation. See comments for details.

Saturday, January 15, 2011

Surface Cooling, Part V

If you go back and look at Surface Cooling, Part III, you will see that we have improved and abbreviated our explanation of the rapid cooling that occurs in the desert when the sun goes down. It was my father who pointed out a simple mechanism by which this cooling must occur. As we already noted, the sand will cool down quickly when the sun sets. As the day-time convection of air above the desert slows to a halt, it brings cool air down from above, and this air will not be warmed by hot sand as it was during the day. It remains cool, which causes the temperature to drop by ten or twenty degrees.

Tuesday, January 11, 2011

Mercury Bulb, Part II

Suppose we expose our mercury bulb thermometer to radiation from the Sun and the ground, as shown below. We have short-wave radiation arriving from the Sun far away, long-wave radiation arriving from the ground just below, and the bulb radiating as well. If we assume the air below the bulb is transparent, the heat the bulb receives from the ground is equal to the heat it would receive from a hemispherical shell of the same material.


The ground and the bulb are opaque to short-wave and long-wave radiation. The emissivity of mercury is roughly 0.10 for short-wave and long-wave, while that of sand and dirt is 0.90 for both short-wave and long-wave.

In the following calculations, we use the letter ε for emissivity, and a subscript to indicate ground or bulb. The radius of the bulb is r. We calculate the net absorption of radiation by the bulb, in Watts. We assume that this extra heat will cause a slight increase in the bulb's temperature over the temperature of the air, leading to conduction of the excess heat away from the bulb. We apply the equation for steady-state conduction we derived last time, and so arrive at an equation for the change in the bulb temperature in terms of power arriving from the sun, ground temperature, and air temperature.


In Arizona over Thanksgiving, we observed the ground to be at around 320 K at mid-day and the air at 300 K. In Solar Heat, we showed that the power arriving from the sun is 1,400 W for each square meter we hold up perpendicular to its rays. A thermometer exposed to the sun and the ground under these conditions will read 1.5°C warmer than the air. At night, we observed the air and the ground to drop to around 280 K. A thermometer free to radiate its heat into space under these conditions will read 1.5°C colder than the air.

Suppose we house our thermometer in a box with holes on the sides to let air through, but a solid roof and floor. We make the box out of a good insulator, like wood. Air can move freely through the box, but radiation from the ground and the sun are blocked. The outside of the box may get hot during the day or cold at night, but the inside surface will settle to the air temperature, along with the thermometer bulb. The radiation the bulb receives from the box will be exactly equal to the radiation it emits towards the box.

During the day, the ground warms the air. In order for heat to pass from the ground to the air, there must be a sharp temperature gradient near the surface, because the conductivity of air is so poor. If we place our thermometer one meter above the surface, it will be out of this heating layer, and so measure the temperature of the main body of air moving along the ground. When the wind blows, the thermometer will be more effective at measuring air temperature, because the movement of air around the bulb greatly facilitates the transfer of heat to and from the bulb. But once again, the wind near the ground can be erratic, or shielded by obstacles, so placing the thermometer a meter above the ground would make sure that it experiences the temperature of the main body of moving air.

We conclude that a thermometer mounted in a perforated box one meter above the ground will give us an accurate measurement of air temperature, despite the effects of radiation, conduction, and convection.

Monday, January 3, 2011

Mercury Bulb, Part I

When the temperature recorded by a thermometer two meters above the desert drops by 10°C in an hour, what does this drop mean? Does it mean that the air has cooled down, or does it mean that the radiating bodies around it have cooled down? When we feel cold walking in the desert at night, is this because the air is cold, or is it because the sand all around us is no longer radiating heat that would otherwise warm our bodies? So far, we have assumed that it is the air that cooled down. In any case, we feel it is time to consider the role played by conduction, radiation, and convection in determining the temperature recorded by a mercury bulb thermometer.

Let us start with conduction. We will simplify the conduction question by considering steady-state heat flow out of a spherical mercury bulb with thin walls. By "steady-state" we mean that no element in our problem is either warming up or cooling down. The heat conducted away from the bulb is constant. The advantage of this simplification is that it has a simple analytical solution, as we show in the following diagram.


Meanwhile, the heat capacity of the bulb allows us to relate the heat flow out of the bulb to the rate at which the temperature of the bulb must be falling, as we show below. In our continuing equations, we use T and r for the temperature and radius of the bulb.


The following graph plots the temperature of mercury bulbs of various radii versus time after a sudden 10°C drop in temperature. We see that a bulb of radius 2 mm will cool to within 0.5°C of the new air temperature within a few minutes.


Most mercury bulbs are a few millimeters in diameter, so it appears that mercury thermometers can measure air temperature accurately provided that the changes in air temperature occur on a time scale of ten minutes or longer. In our next post we will consider whether radiation from the ground, the sun, and the bulb itself will disturb the thermometer's measurement of ambient air temperature.