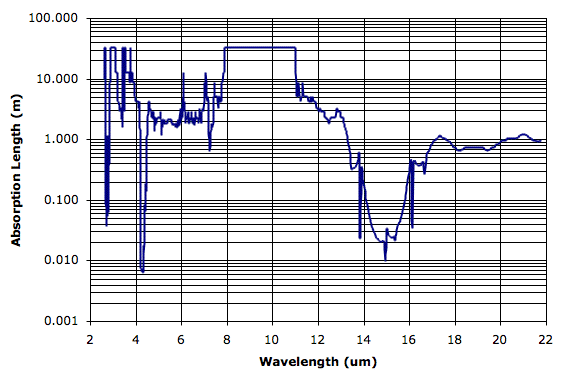
We converted the transmission values into absorption length for pure CO2 at standard temperature and pressure (20°C and 101 kPa). The absorption length (or penetration depth) is the value L in the Beer-Lambert Law of transmission through an absorbing medium. We have A = 1 − e−x/L, where A is the fraction absorbed and x is depth. You will find our plot of the spectrum in our Climate.xls spreadsheet, which is in Climate.zip.

The flat-topped parts of the spectrum are where the original measurements are unable to detect any absorption by CO2 along the 10-cm path, and we have capped the spectrum at around 33 m, which corresponds to transmission of 0.999 in the original data.
We hope to use this spectrum to inform us of CO2's role in the greenhouse effect. We can use the atmospheric concentration of CO2 to determine the absorption length of atmospheric CO2. Before we do that, however, we see that pure CO2 has absorption length greater than 1 m between 5 μm and 13 μm. In our previous post we saw how the Earth's atmosphere is transparent between 8 μm and 13 μm. At 13 μm, the CO2 absorption length plunges by two orders of magnitude until it reaches a low of 10 cm at 14.92 μm. We are still looking for a good water-vapor spectrum, which will allow us to compare the role of CO2 to that of water-vapor in atmospheric absorption. But it looks likely that CO2 is responsible for atmospheric absorption in the 13-μm to 16-μm band.
UPDATE: You will find the text data for the above plot in the CO2 sheet of Climate.xls in Climate.zip. For water-vapor spectrum see Continuum Absorption Length. For the spectrum of diluted CO2 in air, see CO2 Continuum.

Could you provide the data in .txt format that would make things so easy!
ReplyDeleteDownload Climate.zip, open Climate.xls and find the CO2 sheet. There you will see two columns of numbers wavelength and absorption length. Yourss, Kevan
ReplyDeleteKevan, would this be any use?
ReplyDeletehttp://i787.photobucket.com/albums/yy154/RichardDH/AGW/emitt.jpg
Richard111
Hi Richard111. That's a nice graph, and certainly looks like the emission spectra of CO2 and water vapor at 1500 K. But I don't know the density of the layer (in kg/m2) nor the pressure (which plays a part in the water vapor spectrum). We get a better idea of the spectrum of both gases in our later post Earth's Atmosphere. There we present a graph showing the absorption spectrum for various 3-km thick layers of the Earth's atmosphere. Note that we present the absorption spectrum because it is closer to being a property of the gases rather than a property of their temperature. The emission spectrum is the product of the absorption spectrum and black-body emission spectrum (as we have discussed previously).
ReplyDelete