Monday, November 28, 2011

Less Reflection

With 350 W/m2 arriving from the Sun, 75% of the surface covered by water, clouds sinking at 300 mm/s, and each 3 mm of cloud reflecting 63% of sunlight, our CC9 simulation converges upon a surface air temperature of −12°C. When we increase the Sun's power to 400 W/m2, the temperature rises by a mere 0.5°C. Our simulated planet is kept cold by thick clouds that reflect the Sun's light back into space. Ice crystals drift down from the sky in some places, while elsewhere water evaporates from the frozen seas.

The surface of the Earth is at an average temperature well above the freezing point of water, and the Earth's sky is frequently clear of clouds. Our simulated sky never clears, and the surface is frozen. It never rains in our simulation, nor do our simulated clouds emit or absorb radiation. Perhaps these two omissions are responsible for our permanent clouds and frozen seas. Before we attempt to rectify them, however, let us consider the effect of decreasing the reflecting power of our simulated clouds.

We increased Lc_water from 3.0 mm to 6.0 mm, so that it now takes 6.0 mm of cloud water to reflect 63% of the Sun's light. With the reflecting power divided in half, we ran our simulation for eight thousand hours from the starting point CS_0hr. You will find the final state in LR_8000hr.


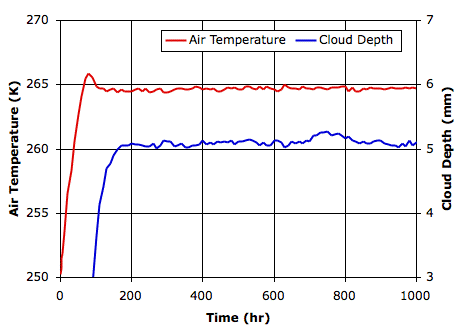
Compared to before, we now have more clouds in the sky. The following graph shows how cloud depth and surface air temperature vary with time.


Compared to before, we see the atmosphere reaches equilibrium in on third the time. The new temperature is higher and the cloud cover is thicker. The following table compares the state of the atmosphere for both types of clouds.


Our seas are now at −3°C. If they contain salt, they will not freeze. The air a few meters above our sandy island will be just below freezing. Our simulated world is still much colder than the Earth, and nobody standing on the island would ever see the Sun. We are, however, gratified to find that our simulation remains stable with such a large drop in cloud reflectance.

Tuesday, November 22, 2011

Negative Feedback

With fast-sinking clouds, our circulating cells program reaches equilibrium in eight hundred hours of simulation time. With the 350 W/m2 arriving continuously from the Sun, the surface air temperature settles to 261 K.

If we increase the power arriving from the sun, it seems reasonable to suppose that the surface temperature of our planet will rise. Indeed, before we added clouds to our simulation, we could use Stefan's Law to answer this question. The planet surface absorbed all the Sun's heat and the surface and tropopause radiated it all back into space, so if we increased Solar power by 4%, the absolute temperature of the surface and the tropopause would increase by 1%. But with clouds reflecting light from the Sun, we can no longer assume that all the Sun's heat will be absorbed, nor even that a constant fraction of it will be absorbed.

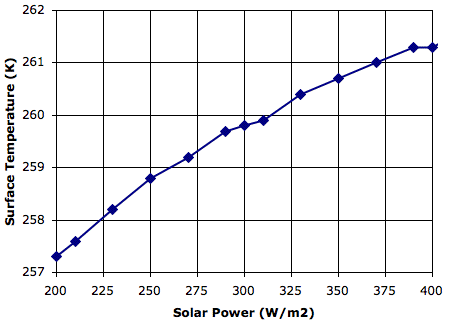
We ran our fast-sinking clouds simulation repeatedly from the same CS_0hr starting conditions, each time with a different Solar power. Each time we stopped the simulation after a thousand simulated hours, so that we could be sure it had reached equilibrium, and recorded the surface air temperature. We obtained the following graph.


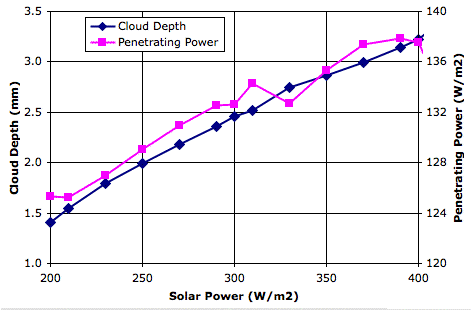
Without clouds, a doubling of Solar power would cause the surface temperature to increase by roughly 20%. Here we increase Solar power from 200 W/m2 to 400 W/m2 and the surface temperature increases by only 1.5%. The following graph shows how the cloud depth increases with Solar power, thus decreasing the fraction of Solar power that penetrates to the surface.


The Sun's light, arriving at the surface, causes evaporation. This evaporation leads to clouds. But these same clouds reflect the Sun's light back into space. Thus one effect of Sunlight arriving at the surface is to reduce the amount of Sunlight arriving at the surface. The effect of clouds is an example of negative feedback. This negative feedback reduces the sensitivity of surface temperature to Solar power by more than a factor of ten.

Tuesday, November 15, 2011

Fast-Sinking Clouds

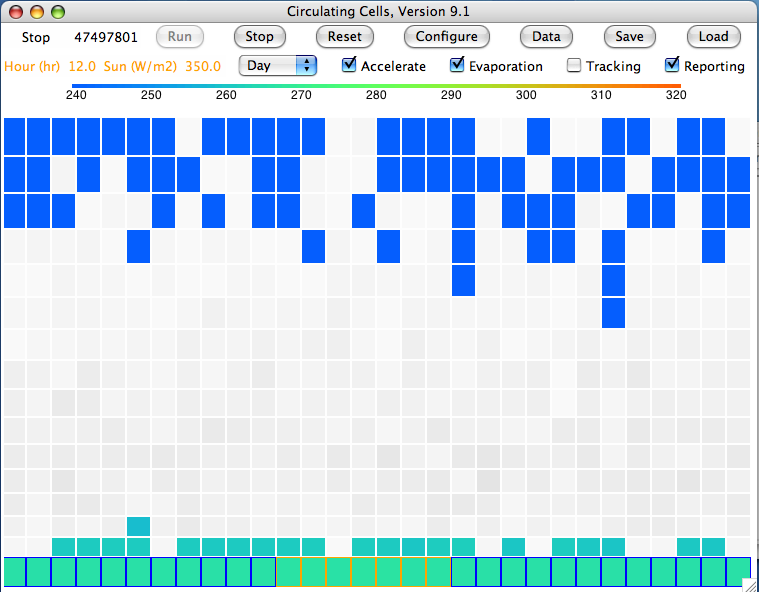
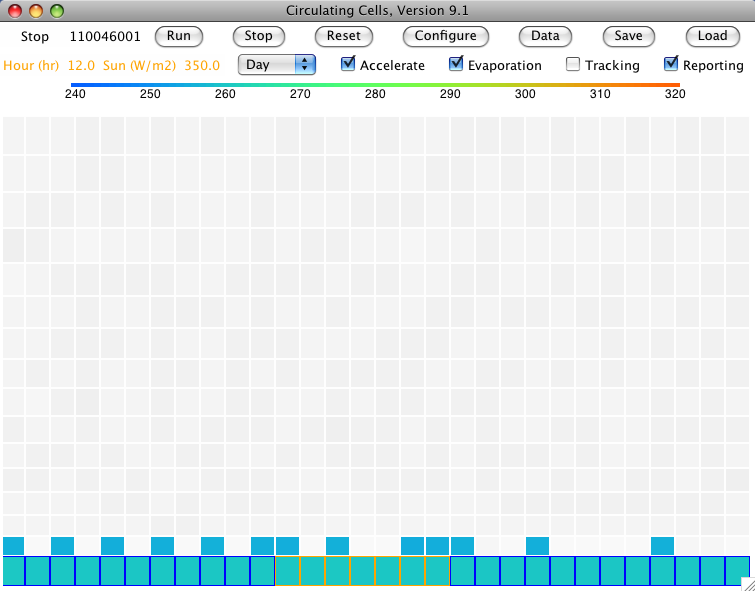
In our previous post we allowed the clouds in our simulation to sink to the surface at 3 mm/s. We implemented this sinking by allowing an average of 0.001% of each cell's water droplets to drop down out of the cell every second (0.1% every 100 s). Today we repeat our experiment from the same starting point, but this time the gas cells lose 0.1% of their water droplets per second, which corresponds to droplets sinking at 300 mm/s. Here is the state of the atmosphere after thirteen thousand hours.


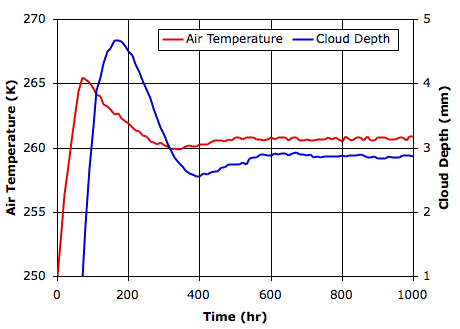
Although our screen shot is taken at thirteen thousand hours, the atmosphere converges to its equilibrium state in a mere eight hundred hours. Our previous simulation converged only after eight thousand hours. The following graph shows surface gas temperature and cloud depth versus time.


The following table compares the equilibrium state of the atmosphere at the end of our two experiments.


The faster-sinking clouds cause the surface to warm by 5.3 K. The Solar power penetrating to the surface increases by 13 W/m2 because the clouds are slightly thinner. You may recall that our current simulation of clouds does not implement their absorption and emission of long-wave radiation, so we are working with transparency fraction set to 0.0, indicating an atmospheric gas that is opaque to long-wave radiation. The only place for this artificial atmosphere to radiate is at the tropopause. So we expect to see the tropopause radiating the same amount of heat that penetrates to the surface: the heat leaving the system must be equal to the heat entering. And indeed this is the case to within a couple of Watts per square meter.

We see that faster-sinking clouds cause the world to warm up, and this is in keeping with our expectation. The icy surface must warm up so that evaporation will keep up with the greater rate of return of water to the surface.

UPDATE: It turns out that our code was allowing clouds to sink only when they took part in a circulation, which resulted in them sinking roughly a hundred times slower than they should have, so our effective sinking rate here was more like 3 mm/s. When we correct our error, so that the clouds really do sink at 300 mm/s, the surface temperature warms by roughly 7 K. [07-JAN-12]

Friday, November 11, 2011

Slow-Sinking Clouds

In Falling Droplets, we concluded that 10-μm water droplets will sink at 3 mm/s in air at pressure 100 kPa. The lowest atmospheric cells in our Circulating Cells program are at 100 kPa, and they are roughly 300 m high, so we see that it will take a hundred thousand seconds for a droplet to fall the height of the cell. Cells higher up are taller, but the gas within them is thinner. A droplet must fall more quickly through thinner air before its weight is matched by air resistance. For simplicity, we will assume that the time it takes a 10-μm droplet to fall the height of a cell is the same regardless of altitude.

As we found in Simulation Time, our program checks each gas cell every one hundred iterations on average, which corresponds to every 100 s. If it takes a droplet one hundred thousand seconds to fall the height of a cell, and the droplets in the cell are evenly distributed, 0.1% of the droplets will sink out of the cell every 100 s. If the cell rests upon a surface block, these droplets will return to the surface. We now have a way for water to leave the surface, by evaporation, and a way for water to return to the surface, by sinking. If the gas cell rests upon another gas cell, the droplets enter the cell below, where they may evaporate.

In Circulating Cells Version 9.1, we specify the sinking speed of droplets at 100 kPa with sinking_speed_mps in units of meter per second. We set sinking_speed_mps to 0.003 m/s and loaded CS_0hr into our array, which is the starting condition we used in Cold Start.

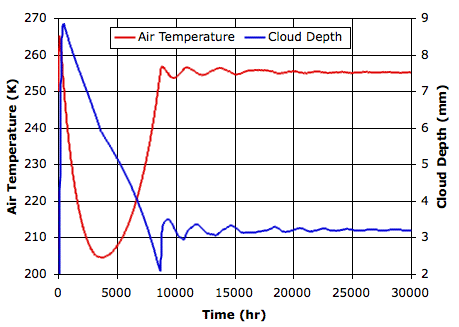
The planet warms quickly in the steady light of the Sun. After two hundred hours, the atmosphere is full of clouds and the planet starts to cool. The clouds sink towards the surface. After four thousand hours, they are thin enough that the sun starts to warm the surface. After eight thousand hours, this warming is stopped by the formation of new clouds. After a thirty thousand hours, the atmosphere settles to the steady state shown below, which you will find saved as a text array here.


The graph below plots temperature and cloud depth versus time for the first thirty thousand hours.


After thirty thousand hours, the sand and water surfaces are both at 260 K (−13°C), and the lower gas cells are at 255 K (−18°C). The average cloud depth is 3.2 mm and the average power reaching the surface is 120 W/m2.

The combination of evaporation and sinking gives rise to an equilibrium in which the clouds allow just enough heat to reach the surface so that evaporation balances the return of water to the sea in the form of sinking droplets. This balance between evaporation and sinking controls the temperature of the planet surface. In our next post, we will increase the sinking speed by a factor of a hundred and see how this affects the surface temperature. We expect the surface temperature to go up, because only then will evaporation keep up with the increased loss by sinking.

UPDATE: It turns out that our code was allowing clouds to sink only when they took part in a circulation, which resulted in them sinking roughly a hundred times slower than they should have, so our effective sinking rate in this simulation was more like 0.03 mm/s. When we correct our error, so that the clouds really do sink at 3 mm/s, the surface temperature warms by roughly 7 K. [07-JAN-12]

Wednesday, November 2, 2011

Falling Droplets

In Clouds Without Rain we saw immortal clouds circulating above a frozen planet, reflecting the Sun's heat back into space. We concluded that it is rain that saves our planet from freezing. It is rain that clears the skies so that the Sun's heat can reach us.

We must implement rain in our simulation, so that water vapor has some way of returning to the surface. Let us begin by considering how fast water drops fall through air. A falling drop accelerates until air resistance matches its weight. At that point, it continues to fall but it does not accelerate. It has reached its terminal velocity. In The Terminal Velocity of Fall for Water Droplets in Stagnant Air, Gunn et al. describe their apparatus for measuring the terminal velocity of water droplets, and present their measurements in graphs and tables. (The paper, published in 1948, is an enjoyable read that you can download here.)

We can calculate the terminal velocity of rigid, spherical objects using Stokes Law. Gunn et al. show that Stokes' Law applies well to water droplets of diameter less than 100 μm (one tenth of a millimeter). You may recall that the droplets in our simulated clouds are roughly 10 μm in diameter (one hundredth of a millimeter). For the droplets are small enough, surface tension is able to maintain a spherical shape in the face of air resistance.

But for droplets larger than 100 μm, Stokes Law over-estimates the terminal velocity. Larger droplets assume flattened shapes as they fall, and they are in constant motion, so that the air resistance they encounter is far greater than it would be for a rigid sphere. When the diameter exceeds 5 mm, the motion of the drop becomes so vigorous that the drop breaks into smaller drops.

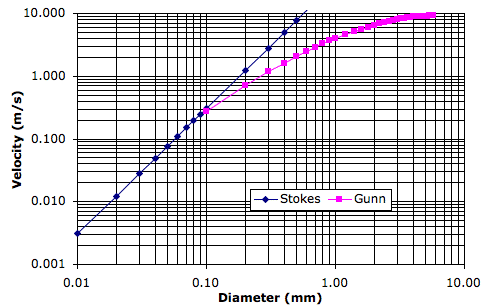
The following graph shows the Gunn et al. measurements of terminal velocity, plotted against droplet diameter. We see that the maximum terminal velocity for the largest possible water droplets is around 10 m/s. For diameters less than 0.1 mm, Gunn et al. assure us we can use the terminal velocity given by Stoke's Law, so we also plot the terminal velocity calculated from Stokes' Law.


The 10-μm droplets in our simulated clouds will fall at a mere 3 mm/s through our gas cells. Given that our cells are a few hundred meters high, it will take a day or two for a cloud to fall from one cell to the cell below. Slow as this may be, the sinking of clouds does provide a way for water to move from one cell to another, and ultimately to return to the planet surface. In our next post, we will see how sinking clouds affect the result of our Cold Start simulation.

Wednesday, October 19, 2011

Cold Start

In our previous post, we presented our simulation of clouds without rain. We started the atmospheric gas, the sandy island, and the watery sea, at a uniform 280 K (7°C). Water evaporated from the sea. The sand heated up in the sun. Hot air rose above the island and sucked moist air in from the sea. Clouds formed above the island, spread through the atmosphere, reflected the heat of the sun, and the world froze.

What if we start with a frozen world and a dry atmosphere? In our simulation of evaporation rate, no water will evaporate from a sea at 250 K (−23°C), so no clouds will form. We ran CC9, starting with the CS_0hr array, to find out what would happen. Our starting point is a uniform 250 K with no water vapor. We run with 350 W/m2 continuous heat from the Sun.

After 20 hrs, the sandy island has warmed to 276 K (3°C). At 30 hrs, the average cloud depth is 0.03 mm, which is so thin that we don't bother plotting the clouds as white cells. But at 40 hrs we start to see the first thin clouds, and the average power arriving from the Sun drops to 335 W/m2. At 50 hrs, the island reaches 283 K (10°C). From here on, it cools. At 100 hrs, the average cloud depth is 3.5 mm and only 120 W/m2 is arriving from the Sun. The sea reaches 267 K (−6°C), which is the warmest it will ever get. By 200 hrs, cloud depth is 7.2 mm and power arriving from the Sun is only 40 W/m2, as recored in CS_200hr.

We can see where the simulation is going to end up: a world kept frozen by immortal clouds. Regardless of our starting point, immortal clouds reflect the Sun's heat and cause the world to freeze.

Tuesday, October 4, 2011

Clouds Without Rain

Today we present Circulating Cells Version 9 (CC9), and we use it to find out what would happen if we had clouds without rain. The simulation implements the following features of clouds.

(1) Evaporation from surface water, as in Evaporation Rate.
(2) Condensation in rising air, as in Condensation Point and Condensation Rate.
(3) Cooling and warming by latent heat of evaporation, as in Latent Heat.
(4) Reflection of incoming sunlight, as in Simulated Clouds, Part I.

The simulation does not yet implement the following features of clouds.

(5) Absorption and emission of long-wave radiation, as in Simulated Clouds, Part II.
(6) Cooling and warming by latent heat of fusion, as in Latent Heat.
(7) Rain and snow.

If we set the simulated atmosphere's transparency fraction to 0.0, we make the atmospheric gas opaque to long-wave radiation. No radiation escapes into space from the surface blocks nor from the rows of gas cells below the top row, regardless of the distribution of clouds within the atmosphere. The top row of cells, which is our simulated tropopause, does all the radiating of heat into space. Although this opaque atmosphere is not realistic, it does mask the fact that our clouds do not in themselves absorb or emit long-wave radiation, allowing us to proceed with a simulation that is at least self-consistent. Thus the copy of CC9 that you can download today has the transparency fraction set to 0.0 by default.

We ignore the warming of rising air by freezing water droplets, and the cooling of falling air by melting ice crystals. We will add ice crystals to our simulation later. For now, we trust that the error caused by our omission is not so great as to overturn the observations we make today.

By ignoring rain and snow, we are ignoring a feature of clouds that is so important to our climate that our simulation produces an entirely fantastic result. To watch the simulation in action, download CC9 and follow the instructions at the top of the code to run the program on your computer. Get the CWR_0hr array file and load it with the Load button. You will see an atmosphere at a uniform 280 K, and down at the bottom, an island of sand in a sea of water, also at 280 K. Press Run and the simulation will begin. The CC9 code runs in "Day" mode by default, with 350 W/m2 arriving continuously from the sun.

Without rain and snow, any and all moisture that enters the atmosphere at the beginning of the simulation remains in the atmosphere for as long as the simulation runs. There is no means by which moisture can return to the surface of the planet. So long as the lower atmosphere is warm enough to absorb water vapor, however, the clouds can appear and disappear. The moisture they contain can either take the form of water vapor, as it will when the surrounding gas is warm, or it can take the form of water droplets, as it will when the surrounding gas is cold.

We represent clouds in our simulation with cells that are shaded white to gray. The thinnest clouds are white and the thickest are black. A cloud with 1 mm of water is white. A cloud with 12 mm of water is black. After 30 hours, the first white clouds appear over the island, the result of moist air from the sea being heated by the island and rising towards the tropopause. When it rises, it cools, and water vapor condenses to form the first clouds.

At 40 hours, the island reaches its peak temperature of around 311 K. After that, the clouds become more numerous. They reflect the Sun's light back into space. The surface begins to cool. After 150 hrs we end up with the following display.
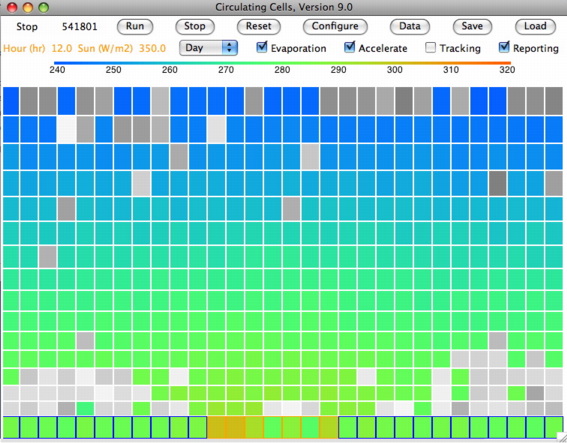


There is fog over the sea and part of the island. There are thick clouds up in the tropopause. The average heat arriving at the surface from the Sun has dropped from 350 W/m2 to only 50 W/m2. The following graph shows how the atmosphere cools in the first 500 hrs.
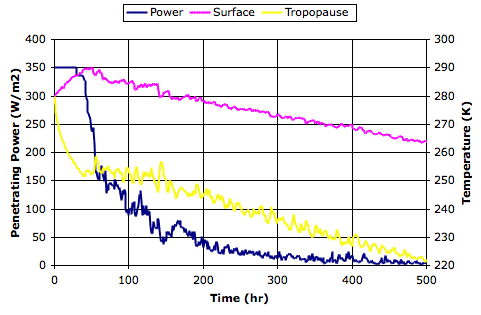


Let us refer to the combined thickness of the clouds above a surface block as is its cloud cover. In our simulation, each 3 mm of cloud cover reflects 63% of incoming sunlight. If we press the Data button, a text window opens and here we will see a line of numbers printed every hour of simulation time. The first number is the time in hours, the second is the average cloud cover in millimeters. The third number is the average sunlight power penetrating to the surface through the cloud cover in Watt per square meter. After that we have four temperatures in Kelvin: average sand temperature, average water temperature, average surface gas temperature, and average tropopause temperature. We used these printed lines to obtain the data for the plot above.

After 3000 hrs, the tropopause has dropped to 158 K (−115°C) and the surface air is at 184 K (−85°C). The average cloud cover is 25 mm. Only 0.7 W/m2 arrives at the surface. You can see this for yourself by loading CWR_3000hr into the simulation. Even at 158 K, the tropopause is still radiating 35 W/m2, which is far more than the 0.7 W/m2 reaching the planet surface. The tropopause will keep cooling until it reaches 60 K, at which point it will be radiating 0.7 W/m2. Of course, at that point, nitrogen will condense into liquid.

If clouds remained aloft in the atmosphere indefinitely, the Earth would freeze. But in reality, clouds are forever falling towards the ground. They are made of droplets and crystals that are heavier than air. Rain and snow are what stop clouds from turning the Earth into a planet of frozen seas.