If we increase the power arriving from the sun, it seems reasonable to suppose that the surface temperature of our planet will rise. Indeed, before we added clouds to our simulation, we could use Stefan's Law to answer this question. The planet surface absorbed all the Sun's heat and the surface and tropopause radiated it all back into space, so if we increased Solar power by 4%, the absolute temperature of the surface and the tropopause would increase by 1%. But with clouds reflecting light from the Sun, we can no longer assume that all the Sun's heat will be absorbed, nor even that a constant fraction of it will be absorbed.
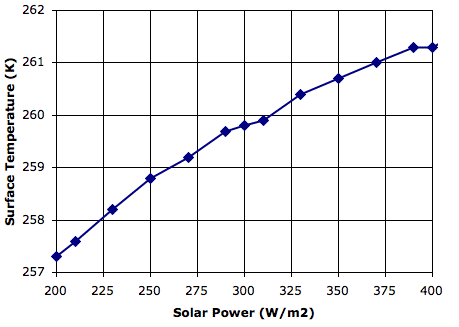
We ran our fast-sinking clouds simulation repeatedly from the same CS_0hr starting conditions, each time with a different Solar power. Each time we stopped the simulation after a thousand simulated hours, so that we could be sure it had reached equilibrium, and recorded the surface air temperature. We obtained the following graph.

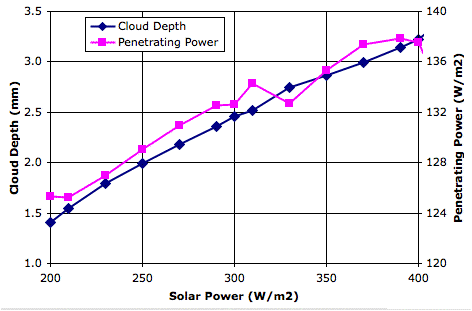
Without clouds, a doubling of Solar power would cause the surface temperature to increase by roughly 20%. Here we increase Solar power from 200 W/m2 to 400 W/m2 and the surface temperature increases by only 1.5%. The following graph shows how the cloud depth increases with Solar power, thus decreasing the fraction of Solar power that penetrates to the surface.

The Sun's light, arriving at the surface, causes evaporation. This evaporation leads to clouds. But these same clouds reflect the Sun's light back into space. Thus one effect of Sunlight arriving at the surface is to reduce the amount of Sunlight arriving at the surface. The effect of clouds is an example of negative feedback. This negative feedback reduces the sensitivity of surface temperature to Solar power by more than a factor of ten.

Then strictly the water vapor and the liquid water are non a GHG as many know all claim!
ReplyDeleteMichele
Indeed. In papers like Solar Influences on Climate, the authors are aware of reflecting power of low clouds. But it's not clear that climate modelers take into account the tremendous power of clouds to reject sunlight. Given that they claim water causes warming, I think it's likely they don't include this easy-to-demonstrate phenomenon.
ReplyDeletePeter Newnam writes: "What is the reason for the sharp drop of penetrating power just past the 400W/m2 mark?"
ReplyDeleteDear Peter,
ReplyDeleteThere is a data point at Solar power 410 W/m2, and Excel is drawing a line to it. This extra data point has penetrating power 134.3 W/m2, which is exactly the same as our measurement for Solar power 310 W/m2. The surface temperature at 410 W/m2 is 261.5 K, higher than for 400 W/m2, but the penetrating power is much lower.
The penetrating power could be lower because there just so happened to be extra-thick clouds at that particular moment when I terminated the simulation. I made no effort to take averages so as to overcome the large variability in the penetrating power from hour to hour. I was expecting larger deviations from the increasing line we see, so the 134.3 W/m2 could be genuine.
Or it could be that I messed up while copying and pasting and I mixed up the 310 W/m2 data with the 400 W/m2 data.
Either way, I wanted a range 200 W/m2 to 400 W/m2, and I did not have time to run the entire simulation for all Solar powers again, which would have been the only honorable way to check that one point, so I ignored it.
Yours, Kevan