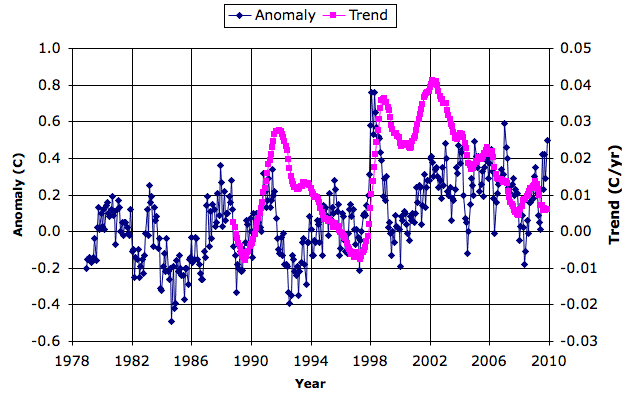
The ten-year warming trend has dropped from a 0.04°C/yr in 2002 to 0.006°C/yr in 2009. Meanwhile, in the mid-troposphere, warming has stopped. So far as we recall, IPCC predictions around the year 2000 said that warming would continue unabated. Perhaps it will start again in a few years, and get going so fast that it catches up with the predictions. Or perhaps not. The anomalies look like random red-noise to me. Good luck to anyone betting their reputation on what the anomalies are going to do next.
UPDATE: Australian farmers don't believe in global warming.
UPDATE: Switching to Google Account comments in hope that this will solve some technical problems.
UPDATE: That crazy temperature trend fools us over and over again.

Over on Open Mind, Tamino has called me an "idiot" and "arrogant", and his readers have weighed in with a few insults of their own. They think ill of me because I suggested that there has been no significant warming in the last ten years.
ReplyDeleteNevertheless, I persisted in asking the same question three times. "Has there been statistically significant warming since 1999?" Tamino refused to post my question the first two times. The third time he snipped my comment and answered "go away."
Tamino calculated the following ten-year trends and associated uncertainties from satellite data:
"For GISS data, the trend from 2000 to the present is +0.0115 +/- 0.018 °C/yr. For RSS data, the trend from 2000 to the present is +0.0017 +/- 0.030 °C/yr. For UAH data, the trend from 2000 to the present is +0.0052 +/- 0.043 °C/yr. Notice all those plus signs."
So, according to Tamino's numbers, there has been no statistically significant warming in the past ten years. The answer to my question was "No."
Tamino's called me an idiot, but his own calculations confirmed my suggestion.
The problem is with the question. There was a 10.4 degree C drop in temperature here overnight suggesting a cooling rate of nearly 4,000 degrees C/year.
ReplyDeleteObviously it makes no sense to compare temperatures over a single day if you're trying to determine the trend because the "trend" so determined would swing wildly. That's a very important clue. As you increase the timescale, so you also allow the large fluctuations due to weather to cancel out, revealing the trend buried beneath all that noise.
In your chart the 10 year trend is clearly all over the place. That's a sure sign that the time period is too short. I have constructed a chart showing the 15 year and 20 year trends in addition to your 10 year trend here:
http://img38.imageshack.us/img38/6883/uahtrends.jpg
(I chose to centre each point on the trend line within the period it was calculated over but the graph is consistent with yours.)
Note that the 15 year trend still wiggles around a bit but things are much more settled with the 20 year trend.
Note also that the anomaly line is perfectly consistent with the trend constructed from *all* of the data. It's wiggling up and down along that line but it certainly isn't *diverging* from it, and that line *hasn't reduced slope* in the past decade.
Unfortunately, because we can't use shorter periods to work out the trend, it would take much longer than 10 years to determine if a change in the warming trend was actually underway.
Nice graph. It is indeed true that the longer the period over which you take an average, the less short-term fluctuations you see, and your graph illustrates this point well.
ReplyDeleteIt looks to me as if you are assuming that climate is not a random red-noise phenomenon on scale of one century to the next. I don't thing there's any point in looking for trends at all. On the scale of hundreds of thousands of years, the climate appears to have two stable states: warm (like now) and cold (like ice age).
On the scale of hundreds of thousands of years, the climate appears to have two stable states: warm (like now) and cold (like ice age).
ReplyDeleteRight. That would be because of Milkanovitch cycles but your line of either/or fallacious thinking leads me to be there's an electrical synaptic short in your onboard system. You aren't alone but still have no significance statistical or otherwise. The majority rules on the preponderance of evidence.
What evidence are you talking about? I'd like to see it.
ReplyDeleteNot really fair to insult Kevan, assert that there is overwhelming evidence and then when politely asked for the evidence, not provide it.
ReplyDelete