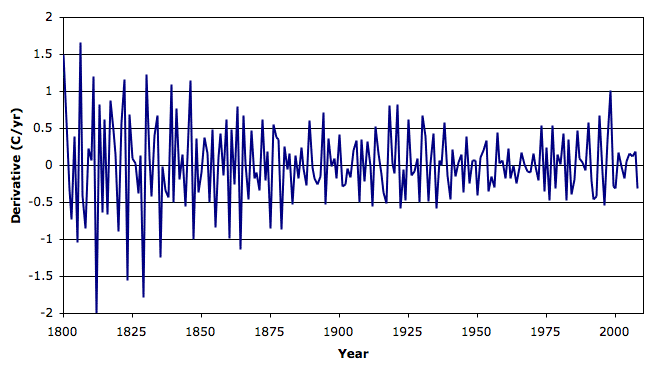
The distribution of these changes is not quite a normal distribution, but it's close. Its average value is 0.01°C for the entire period, and its standard deviation is 0.5°C. For period 1930−1990, its standard deviation is 0.3°C.

At the end of our essay on climate models, we suggest that a good model for the climate is a random change from one year to the next with normal distribution and standard deviation 0.3°C.
We challenged our readers to show that the climate is not dominated by random fluctuations. We posed the same question at Real Climate. We received three forms of answer. One was that the climate has been affected by volcanic eruptions and long-term solar cycles, therefore it is not random. Another was that we must assume things are not random, or else we can't believe in any scientific theory at all. Another was that experiments upon the climate are impractical (see this response from Gavin Schmidt), and because such experiments are impractical, climatologists should be excused from proving their theories with experiments.
We conclude that there is no empirical basis for a belief that recent climate trends are anything but random. Climatologists admit this lack of empirical basis openly, but insist that such a basis is not necessary to justify their belief in anthropomorphic global warming. What we have here is a disagreement about scientific method between those of us who work in physics and those who work in climatology.
UPDATE: Here is another red-noise analysis, shorter term, over at The Reference Frame.

Excellent. By the way, I think that the higher variations in the 19th century are not real - they are due to less accurate measurements that didn't cover as many stations and regions as today, so the noise gets inflated.
ReplyDeleteYes, your suggestion is supported by the graph of the number of available stations with year, see earlier post. The number of stations rises from a few dozen in the early 19th century to over 7000 in the 1960s, and back down to a few hundred in 2005. If you have anything to say about how the change in the number of stations might affect the trend, I'd like to hear it. We have been thinking about it a fair bit.
ReplyDelete