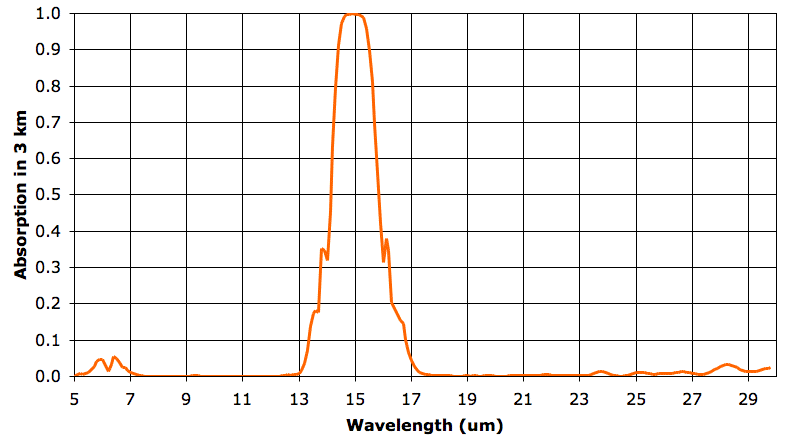
In the sixth layer, absorption by water vapor is nowhere more than 5%. But absorption by CO2 remains strong. As before, we say our 3-km layer is opaque at a particular wavelength when it absorbs more than 63% of that wavelength, and is transparent otherwise. The sixth 3-km layer is opaque from 14.3 to 15.7 μm and transparent otherwise. The fifth layer, immediately below, is opaque to 14.2 to 15.8 μm. It radiates in these wavelengths also. The sixth layer absorbs 90% of the heat radiated upwards by the fifth layer, but the remaining 10% will pass out into space.
The fifth and sixth layers are at the same temperature. We did not make up the temperatures, pressures, and concentrations we use in our 3-km atmospheric layers. We obtained them from actual measurements of the Earth's atmosphere.
We have talked at length about the tropopause that exists at the top of the convection cycle in an atmospheric greenhouse. In our simple examples, the tropopause marks the top of the convection cycle, and occurs when the atmosphere above becomes so thin as to allow heat to radiate directly into space. The Earth's atmosphere is not so simple as in our examples. Above 12 km, the Earth's atmosphere is transparent to most long-wave radiation, but remains opaque in the narrow band that is absorbed by CO2. At a high enough altitude, this CO2 will become thin enough that it becomes transparent. But the tropopause of the Earth's atmosphere appears to occur at a lower altitude. It occurs when the atmosphere is transparent to over 90% of long-wave radiation.
In later posts, we will see how absorption by ozone in the stratosphere effects our greenhouse convection cycle. In the meantime, we will accept that there is very little change in temperature from altitude 12 km to 18 km, and therefore these altitudes mark the top of the Earth's greenhouse convection cycle.

Hi Kevan,
ReplyDeleteThis makes interesting reading. I want to know more about the controls on variation in height of the tropopause. Keep going.
HR
I think we'll get there eventually. I'm glad to have you along for the journey. In case you hadn't noticed: I don't know where the story is going, either. I'm just trying to make sure that each step I take is correct.
ReplyDeleteKevan, The atmospheric pressures in your higher altitude 'layers' look high to my inner pilot. Pressure at 15km/50000 feet is 330mBar/30% of SP? Something wrong there, I would expect about 10% or so.
ReplyDeleteRgds,
I think you're right: my estimate is too high. I'm saying pressure at 15 km is 220 mBar, or 22% of SP. That's what I get from our constant-temperature calculation in Atmospheric Pressure:
ReplyDeletehttp://homeclimateanalysis.blogspot.com/2010/03/atmospheric-pressure.html
But a graph of observed pressure versus altitude suggests that the pressure is closer to 180 mBar.
http://www.ux1.eiu.edu/~cfjps/1400/atmos_struct.html
I guess I should have used the observed values, but I think the absorption spectra are still good enough. I hope you agree.
The pressure at any given altitude would I guess be the sum of the partial pressure of the constituent gases at that altitude. If the total pressure is lower than calculated, it would suggest to me that the actual altitude at which that pressure applies, is actually lower than where our calculations place it.
ReplyDeleteBut, since we're looking at relative relationships rather than absolute, we need not concern ourselves too much with an absolute altitude, since the whole lot can simply slide up and down to match reality? Much as, in the real world the atmospheric processes would adjust, and 'makes themselves comfortable' with whatever conditions prevailed at the time?
What you're showing is a synthetic examination of the radiative mechanisms in action, the fact that they would not be at EXACTLY some presumed altitude makes little difference to my untutored eye. That mix of gases will have those characteristics will have those characteristics at some level in the radiative path, and it will be placed at a higher level than those shown by the lower 'layers', would be my summary?
Yes, your summary looks good to me.
ReplyDeleteWe are trying to move from "CO2 traps heat in the atmosphere" to "the atmosphere radiates its heat in several bands at several altitudes". The "CO2 traps heat" model does not hold up in the face of simple experiments like our cling-film diaper, where we see the addition of a greenhouse layer causes an object to cool down rather than heat up. The "CO2 traps heat" model is as gross a simplification as our original Extreme Greenhouse. By dividing the atmosphere into layers, we are greatly enhancing our model. With the structure of the model in place, we can, as you say, slide the layers up and down, and make changes to the detailed spectra.
This comment has been removed by the author.
ReplyDelete