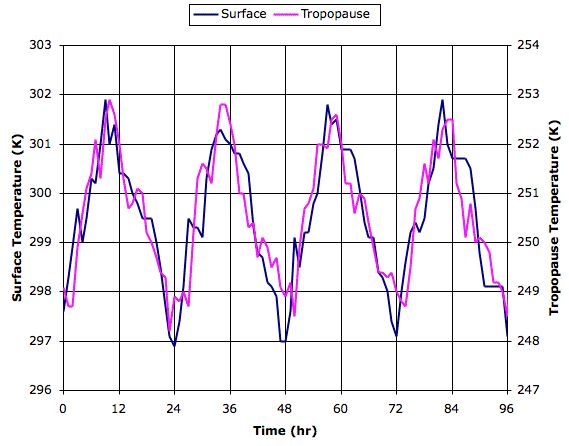
As in the Planetary Greenhouse, the surface is something like sand. It heats up quickly and warms the bottom cells of the atmosphere. Now that the planet is rotating, the heat from the sun increases from zero at dawn to a maximum at mid-day, and decreases to zero again at sunset. We use a sinusoidal profile for the rise in solar heating during the day. For the entire night, no heat arrives at all. In the middle of the day, heat arrives from the sun at a rate π × Q_heating. When day_fraction is one half (the days and nights are of equal length), the average rate at which the bottom cells are warmed by the sun is Q_heating. But when the day is shorter, the average warming is less than Q_heating, and when the day is longer, the average warming is greater. For now, we leave the fraction at one half.
The top cells, meanwhile, radiates heat into space just as they did for the Planetary Greenhouse. Top cells cool by Q_heating per second when they are at temperature T_balance. Their cooling rate increases as the fourth power of their temperature.
We allow the Rotating Greenhouse simulation to run. The report line gives us the time in hours instead of the iteration counter. In the top-left of the report window we see the current rate of solar heating, in units of K/hr. After many days, the cycle of day and night reaches equilibrium, and we see the following each day.

During the day, the surface cells warm as they absorb the Sun's heat. Once they warm by a few degrees, they rise, as we describe in Impetus for Circulation. The average temperature of the surface rows rises by a few degrees during the day, but not more. Our simulation does not allow surface cells to cool. And yet the average temperature of the surface row drops by a few degrees at night. When we mark a few cells near the surface, and watch them move after night falls, we see the surface cells being replaced by cooler cells from above. It is air descending from above that cools the surface row. And so our simulation confirms the mechanism for surface cooling we described in Surface Cooling, Part III.
Our simulation does not, however, show the sudden ten-degree cooling we observe standing in the desert just after the sun sets. Understanding this sudden drop was the motivation behind our Surface Cooling series of posts. Next time, we will use CC5 in its Surface Heating configuration to simulate the transport of heat within one or our large surface cells, and so obtain an estimate of how much the first twenty meters of the atmosphere will warm up during the day.
PS. You will find the array data corresponding to the start of the day with Q = 0.001 K and no cell mixing in RGH_Q001

I think that there is a phase shift between the heating of the surface and that of the troposphere because of the thermal capacity of the atmosphere.
ReplyDeleteFurthermore, we know that the tropopause at tropics is colder than at poles despite at the ground there occurs the contrary as the atmosphere expands when it warms and so it becomes higher.
http://www.atmosphere.mpg.de/enid/ss__Estensione_e_composizione/-_verticale_6h4.html
Surely, the range of top temperature is less than that of the bottom and perhaps out of phase, viewing the difference of tropopause temperature at tropics and poles.
Michele
Dear Michele,
ReplyDeleteThere is a phase shift in the simulation: about 2 hours between the peak of the surface temperature and the peak of the tropopause temperature. That's the time it takes for cells to rise through the atmosphere (6000 iterations = 6000 seconds).
I think the point I tried to show with the Surface Cooling posts, and now again here, is that the cooling from day and night is not due to the air losing heat, but instead due to cold air descending from above and not being heated by the sun.
The page you linked to is pretty cool. I like the graphic of the cell rising and expanding. Yes, I agree that the tropopause is lower in the poles. I believe that is because humidity reaches higher up, so the layer at which the atmosphere becomes transparent is higher.
Yes, I thought the change in the top would be less, but it's not, at least not in the simulation. Cold air sinks from the top, pushing air up from below. But that air has not been warmed by the sun, and so is colder than before. The temperature drops.
I think I should run the simulation again and see what happens in the middle layers.
Yours, Kevan