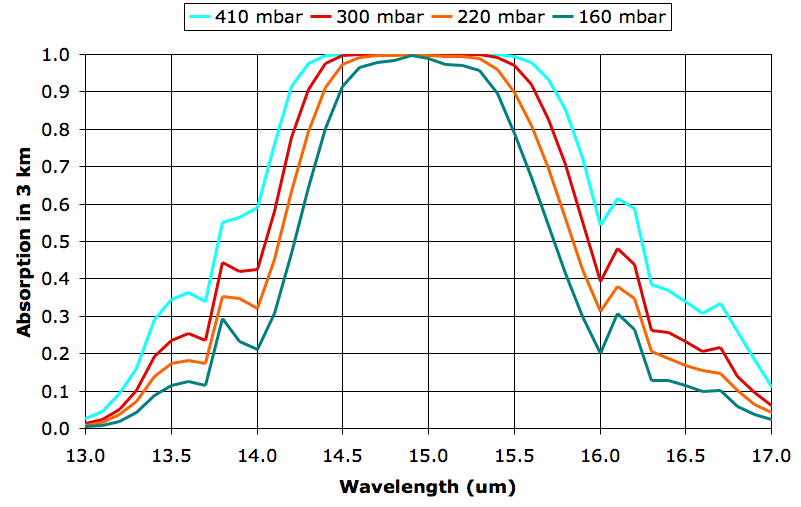
The four graphs are for 9, 12, 15, and 18 km, but we have named them after their atmospheric pressures, 410, 300, 220, and 160 mbar respectively. These pressures do not, in fact, correspond exactly to the pressures we observe in the atmosphere, because our pressure calculation ignores the drop in temperature as we ascend, but we used these pressure values when we calculated the spectra.
What we see between the absorption at 160 mbar and 300 mbar is the effect of doubling the density of CO2 molecules. In both cases, CO2 concentration is 330 ppm, which means 330 out of every 1,000,000 molecules are CO2. But the number of molecules per cubic meter increases approximately with the pressure, so the 300-mbar plot represents twice as much CO2 per cubic meter as the 160-mbar plot.
The absorption at 160 mbar for wavelength 14 μm is 21%, rising to 99% at 15 μm. The absorption at 300 mbar for wavelength 14 μm is 42%, rising to 99% at 15 μm. Twice as much CO2 in a 3-km layer leads to twice as much absorption of 14-μm radiation, but no significant increase in absorption of 15-μm radiation. We are particularly interested in the effect of doubling CO2 concentration, so let us try to get a better idea of how much more absorbing power the atmosphere has at 300 mbar than 160 mbar. Suppose a lower layer of the atmosphere emits uniformly in the band 13-17 μm, so that there is equal power in each 0.5-μm division of our graph. We can count squares under each graph and divide by the total number of squares to get the fraction of power absorbed by CO2 at each pressure. We come up with 43% at 160 mbar and 56% at 300 mbar.
Of course, the lower layers of the atmosphere do not radiate uniformly in the 13-17 μm band. Their radiation in this band is dominated by their own CO2, in accordance with radiative symmetry. The 300-mbar layer will receive radiation from the 410-mbar layer below it, and this radiation will have a power distribution that matches the 410-mbar layer's own absorption spectrum. At 14 μm, for example, the 410-mbar layer will radiate only 60% as much power as it does at 15 μm. In our spreadsheet we multiply the radiation spectrum of the 410-mbar layer by the absorption spectrum of the 300-mbar layer, and find that the 300-mbar layer absorbs 74% of the radiation arriving from the 410-mbar layer below. Meanwhile, the 160-mbar layer absorbs 70% of radiation from the 220-mbar layer below it.
The greenhouse effect causes a convection cycle in the Earth's atmosphere, which transports heat from the Earth's surface to the tropopause. All layers of the Earth's atmosphere up to the tropopause radiate heat out into space through the thinner, upper layers. As our previous posts have shown, radiation by the lower layers is dominated by water vapor, while radiation by the upper layers is dominated by CO2. Our calculations suggest that doubling the atmosphere's CO2 concentration will cause only a slight increase in the absorption and emission of radiation by the upper layers. In future posts, we will try to estimate how much this slight increase in absorption will raise the surface temperature of the Earth.

LS
ReplyDeleteThe public is made to believe that an increase in CO2 concentration will cause a (not small) increase in hot-house effect.
Do you know of a source where CO2 absorption data are (discussed and) presented as a function of variations in atmospheric CO2 concentration?
JH Boelens
ret. Geologist
jhboelens@hetnet.nl
Netherlands.
If you follow our discussion here, I think you will find answers to these questions. We have many posts on CO2 absorption. We obtained our best CO2 absorption data from the Spectral Calculator, which you have to pay to use. But we have links in our posts to raw data that you can download and plot.
ReplyDeleteIR ar 13 microns is consistent with a blackbody of temperature -50 Degree C. How in the world can radiation "heat" at -50 Degree C warm the globe?
ReplyDeletehttp://www.spectralcalc.com/blackbody_calculator/plots/guest1201988774.png
What do you mean by "13 microns is consistent with a blackbody of temperature -50C"? Do you mean that 13 μm is the peak emission wavelength of a body at −50°C, and therefore 13-μm infra-read photons somehow carry the property of cooling things down to −50°C? If so, consider the following experiment. I make a machine that produces 10^24 of 13-μm photons every second, emitting them in a beam 1 m in diameter. Each of these photons carries 0.1 eV (electron-volts) of energy. Together they represent a little over 10 kJ of energy per second. If I stand in this beam, my clothes and skin will absorb these photons, and their energy will cause the atoms in my clothes and skin to vibrate more vigorously, which is to say: I will warm up. Photons carry energy regardless of the temperature of the object that emitted them.
ReplyDelete