We started CC11 from this equilibrium state. We increased the solar power to 110 W/m2. After two thousand hours of simulated time, we increased the solar power to 130 W/m2. We ran for another two thousand hours of simulated time, after which we increased the solar power again. The program performs the solar Increases automatically, so we were able to walk away from the computer and let the simulation run on its own.
The following graph shows surface temperature and solar power plotted against simulation time in weeks. The purpose of this plot is to determine if our simulation reaches equilibrium at each value of solar power.
Below 270 K, we see see the surface temperature is still increasing two thousand hours after the increases in solar power. Perhaps ten thousand hours at each step would be enough. But we are faced with a practical problem of execution time: it took one full week for us to obtain the graph above, with a computer dedicated to the job running continuously.
Once the surface temperature gets above 270 K, however, the evaporation cycle starts up and we see the effects of negative feedback. The changes that result from increases in solar power are markedly smaller and they establish themselves more quickly. Thus our program of solar Increase appears to be gradual enough for temperatures above 270 K, and these are the temperatures we are most interested in.
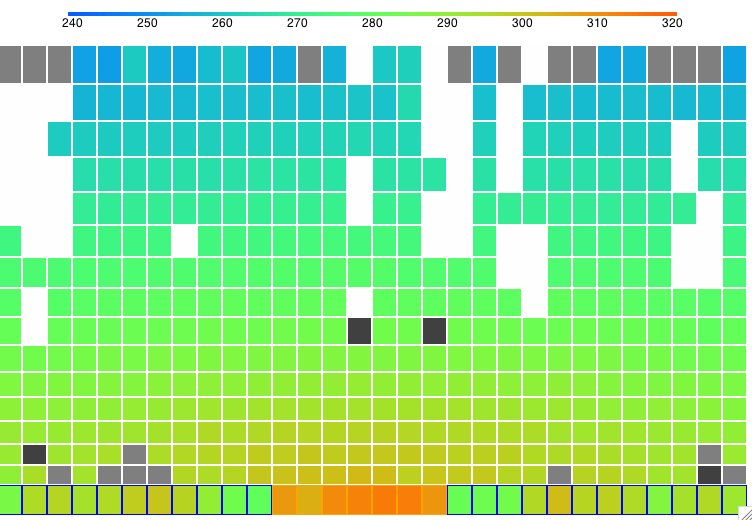
The following figure shows the equilibrium state of the atmosphere with 490 W/m2 solar power. The running simulation shows vigorous cloud formation and precipitation. You can view this for yourself by downloading CC11, loading state SI_490 into the program, setting Q_sun to 490 in the configuration panel, and pressing Run.
By next week, we hope to have obtained the equilibrium state of our simulation for solar powers 100 W/m2 all the way up to 900 W/m2.

No comments:
Post a Comment