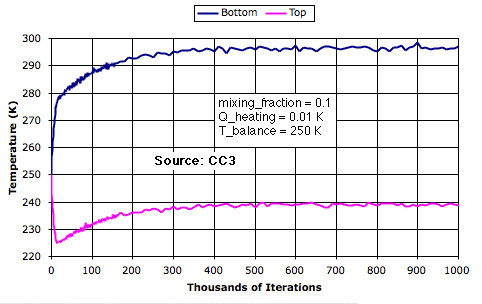
The top row represents our simulated planet's tropopause. We see the top row cooling during the first ten thousand iterations as it radiates its heat into space. At the same time, the bottom row warms up as it absorbs heat from the Sun. After the first ten thousand iterations, convection starts to transport this heat away from the bottom row and deliver heat to the top row. The pace of warming and cooling slows down. After a few hundred thousand iterations, the top row settles at 239 K while the bottom row settles at 297 K. When we watch the simulation, we see cells rising to the top, cooling, and sinking to the bottom in convection cycles. Now that thermal equilibrium has been reached, we know that the top row must be losing heat at the same rate that heat enters the bottom row.
Because we set T_balance to 250 K, we know the top row in our simulation will radiate as much heat as is arriving from the sun when its cells are all at 250 K. But the top cells radiate heat in proportion to the fourth power of their temperature. Furthermore, the temperature of the upper cells is not uniform. Cells arriving from below are warmer. Those that are warmer will radiate disproportionately more than those that are cooler. As a result, the average temperature of the top row can be less than 250 K. We will consider this effect in more detail later. Today we want to present the effect of mixing upon circulation. (UPDATE: The convergence to 240 K turns out to be due to our ignoring work produced by circulation, but this omission has little affect upon the magnitude of warming caused by mixing.)
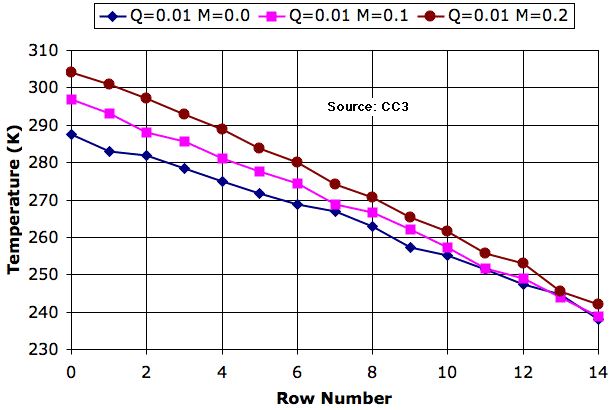
We run our simulation three times, each with a different value of mixing fraction. After a million iterations, we plot the average row temperature versus the row number, which we call the temperature profile. In the legend, Q is Q_heating and M is mixing_fraction.

With no mixing, once a cell warms up in the bottom row, no heat passes in or out until it reaches the top. In the top row, it radiates its heat into space and cools down. Without mixing, the bottom row is 49 K warmer than the top. When we allow the cells to mix with their neighbors, each cell loses heat to its cooler neighbors and gains heat from its warmer neighbors. We see that when mixing_fraction is 0.1, the bottom row warms up until it is 58 K warmer than the top row. When mixing_fraction is 0.2, it is 62 K warmer.
We might think that the exchange of heat between atmospheric cells would encourage the overall transport of heat through the atmosphere, and so decrease the temperature difference between the bottom and the top. But quite the opposite is the case. In our next post, we will endeavor to explain why. At the moment, we don't have a compelling answer. Indeed, it may be that the warming caused by mixing is nothing more than a flaw in our simulation. Your thoughts on the subject will be most welcome.

No comments:
Post a Comment