The first thing BEST addresses when they describe their calculation is the number of available weather stations, and how many of they should use to calculate a trend. We considered the same problem at length here and in brief here. According to BEST, there are around fifteen thousand weather stations reporting daily from 1970 to 2010. The Climatic Research Unit (CRU), the National Climatic Data Center (NCDC), and we ourselves based our calculations upon the GHCN station data. According to BEST, the GHCN data includes fewer than one in ten of the stations that recorded temperatures in 2000. The BEST team hope to use a greater fraction of the available stations.
BEST provided testimony to the US congress on 31st March. They have already applied their basic calculation to 2% of the fifteen thousand stations available in the period 1970 to 2010. They made no effort to correct for systematic errors like urban heating. And yet they arrive at a global surface temperature trend almost identical to that of CRU and NCDC. Here's what they have to say about this agreement.
The Berkeley Earth agreement with the prior analysis surprised us, since our preliminary results don’t yet address many of the known biases. When they do, it is possible that the corrections could bring our current agreement into disagreement. Why such close agreement between our uncorrected data and their adjusted data? One possibility is that the systematic corrections applied by the other groups are small. We don’t yet know.
We were just as surprised when we reproduced the CRU trend from the GHCN data by integrated derivatives. We used no reference grid. We used no corrections for systematic errors.
NASA estimates the urban heating effect in US weather stations to be roughly half a degree centigrade during the twentieth century (see our post here and NASA's paper here). But CRU claims that urban heating is either negligible or has been accounted for in their efforts. And NASA applies 0.5°C corrections and goes on to say that the corrected trend still shows a rise of 0.5°C in the twentieth century, and they claim this trend is accurate to ±0.1°C. We find all this confusing, and so do the people at BEST, which is why they are re-calculating the trend.
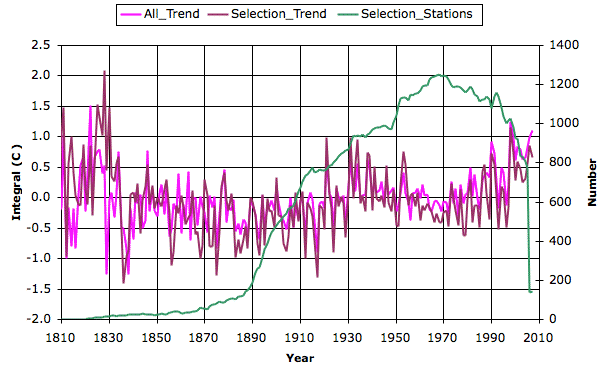
The GHCN inclusion criteria are another potential source of systematic bias in the trend. If we select stations from within the GHCN data set according to various criteria that appear to have nothing to do with temperature, we find that the trend alters in a significant way. The graph below shows the trend we obtain if we select from the GHCN data set only those stations that are reporting for at least 80% of the years between 1960-2000. We get a trend in which the 1930's are as warm as the 1990's.

We await with interest the BEST project's investigation of the effect of urban heating and station inclusion. We look forward to examining their trend-calculation algorithm. We have argued before that all such methods, with or without a reference grid, are pretty much equivalent, so we expect them to come up with something similar to the CRU and NCDC trends before they start to correct for systematic errors.
How BEST will correct for systematic errors in any meaningful or accurate way, we cannot say. If it was up to us, we would select long-lived stations in rural locations, and use the trends from those, even if there were only a dozen of them. But we have tried that already, and we get plots like the one above. The 1930s were hot, and it's just as hot now. But not especially hot.

No comments:
Post a Comment