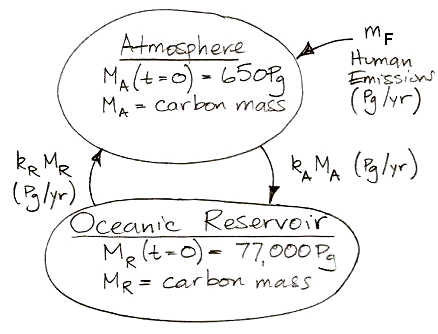
Or, expressed as two differential equations, it looks like this:

We can solve these differential equations in the same way we already solved those of carbon-14 concentration. Examining the equations, we see that we can obtain the behavior of non-radioactive carbon by setting the decay constant, γ, to zero and inserting the the human emission of carbon in place of the cosmic ray creation of carbon-14. More convenient than the analytic solution for our purposes, however, is a numerical solution that we can implement in a spreadsheet and combine with the historical and projected values for mF as our study progresses.
In the numerical solution, we pick a time step small enough that changes in the masses and transfer rates are negligible during the step. Suppose our step is δt. Provided δt is small enough, we can assume, for example, that mA during each step is equal to kA times the value of MA at the beginning of the step. We do not have to account for the fact that MA may be changing during the step, because the time step is so small these changes will be negligible compared to MA. For our carbon cycle, it turns out that one year is always a small enough time step, and in long, slow developments, ten years is small enough.
The following equations are the numerical equivalents of our differential equations. They show how we calculate MA and MR at time t+δt using their values at time t.

The current rate at which humans emit carbon by burning fossil fuels is close to, 10 Pg/yr. In our next post, we will set mF to a constant 10 Pg/yr and calculate how our natural, equilibrium atmosphere responds over ten thousand years.
PS. If you find our carbon cycle drawing too confusing and drab, you can try this one drawn by my youngest son.

No comments:
Post a Comment