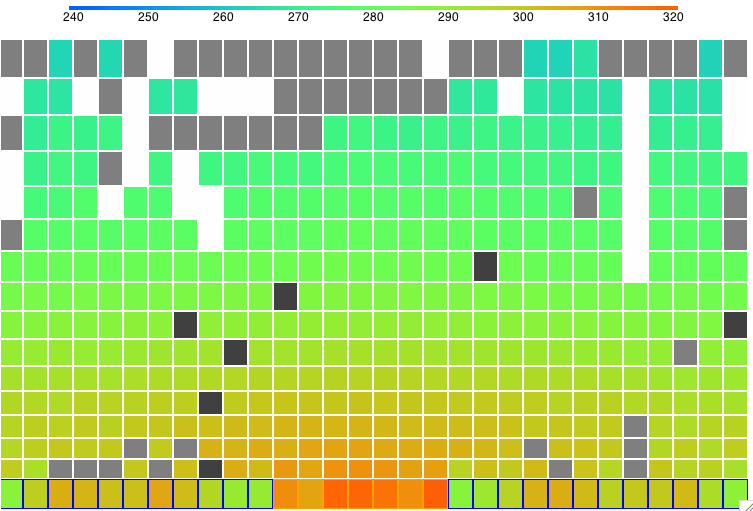
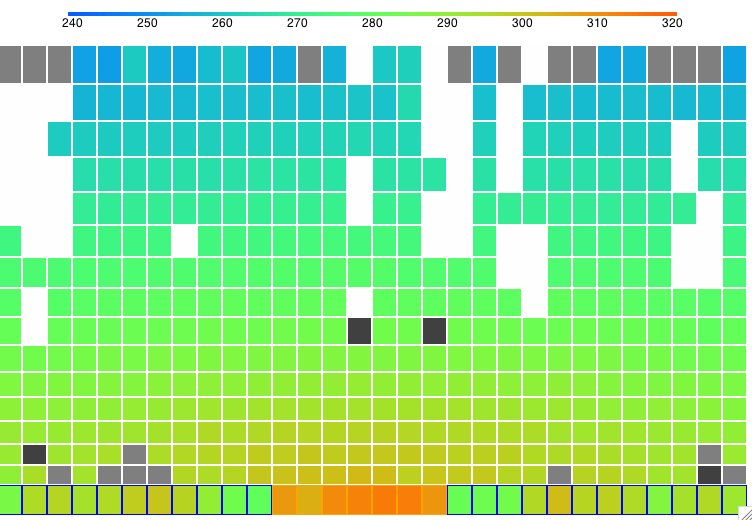
In our pervious post we observed that some properties of the atmosphere, such as penetrating power, fluctuated greatly from one measurement to the next. In order to reduce the influence of these fluctuations, we took the average of the last 500 hours of measurements at each value of incoming solar power, and so obtained a value for each property at each solar power. The graph below shows how some of these properties vary with solar power.
Surface temperature increases hardly at all from 800 W/m2 to 1200 W/m2, and yet cloud cover increases steadily. How can it be that cloud cover increases when the surface temperature, which drives evaporation, hardly increases at all?
In our simulated evaporation cycle, precipitation beings with the formation of snow in air below temperature Tf_droplets. We have this parameter set to 268 K, which is five degrees below the freezing point of water. When solar power reaches 800 W/m2, the average temperature of the tropopause has reached 268 K. Snow can form only in the colder clouds of the tropopause, and nowhere below the tropopause. Each time we increase the solar power, the surface temperature at first warms a little, but within a few hundred hours, this warming reaches the tropopause, where it further slows snow formation, and increases the cloud depth. With more sunlight being reflected back into space, the surface cools again until it is hardly warmer than it started. For solar powers greater than 800 W/m2, an increase of 100 W/m2 causes a substantial increase in cloud depth (roughly 0.5 mm), a slight increase in tropopause temperature (roughly 1 K), and an increase in surface temperature too small for us to detect (less than 0.3 K).
This profound suppression of warming by our simulation is not, however, a good representation of what would happen in the Earth's atmosphere. In our simulation, gas cells that contain clouds cannot rise above our top row of cells, so there is a limit to how much they can cool down. In the Earth's atmosphere, clouds can rise as far as they need to in order to cool down and produce snow rapidly. Thus our simulation is no longer realistic once its tropopause approaches the melting point of ice. We will therefore concentrate our attention upon the behavior of the simulation for solar powers less than 600 W/m2, for which our simulated tropopause is well below the temperature required for the rapid formation of snow.